You Deployed Your Agents. Now What?
Once your agents are in production, the hard part begins. See how Catalyst makes it possible to trace failures, surface bottlenecks, and operate multi-agent systems reliably — using a multi-agent orchestration quickstart as a running example.
Eileen Yu
Software Engineer
Sam Coyle
Senior Software Engineer
Introduction
Debugging agents in production is fundamentally different from building them.
You might have multiple agents coordinating across different frameworks, calling LLM providers, persisting state, and fanning out workflows in parallel. When something fails, the question is no longer "does it work?" — it's "where did it fail, and why?"
The operational challenges discussed in this post are not specific to any single agent framework. Whether you're running Dapr Agents, agents connected through MCP servers, custom orchestration stacks, or heterogeneous multi-agent architectures, the core problems remain the same: understanding execution flow, tracing failures, and operating distributed agent systems reliably in production.
This post walks through how to debug and understand agent failures in production using Diagrid Catalyst.
We'll use the multi-agent orchestration quickstart as our reference scenario: a system of specialized agents built across different frameworks, coordinated through an orchestrator to complete end-to-end tasks. Once deployed, this kind of system quickly introduces complexity — multiple agents, multiple LLM providers, shared state, and parallel workflows.
In this example, Dapr provides durability and rich telemetry for part of the system. The focus is on how those runtime signals turn into an operational debugging experience in Catalyst.
What signals are available when debugging agent systems
When debugging agent failures, you need visibility into LLM calls, workflow (or steps) execution, state interactions, and cross-agent communication.
In this example, Dapr provides durability and emits the signals needed for debugging — traces, metrics, and end-to-end execution visibility — through two complementary layers. Dapr handles application-level telemetry automatically, while the Dapr Agents Python SDK instruments agent-specific behavior such as LLM calls, tool invocations, and reasoning chains via OpenTelemetry. Enabling AgentObservabilityConfig is all it takes — no custom instrumentation code required. By adding durability and telemetry with Dapr, many other agent frameworks can be integrated, including LangGraph, Microsoft Agent Framework, Google ADK, and more.
Distributed Tracing via OpenTelemetry (OTEL)
Using Dapr, every LLM call emits span attributes including input/output token counts and prompt cache metrics. Dapr generates OTEL — compatible spans for every Dapr API call — workflow invocations, pub/sub messages, state interactions for conversation history or memory, and conversation API calls, giving you end-to-end trace correlation across the full execution path. Traces can be exported to Zipkin, any OTLP backend, or routed through an OpenTelemetry Collector to Jaeger, Datadog, New Relic, and others.
Prometheus Metrics from Dapr
Dapr exposes Prometheus metrics covering workflow health, state operations, resiliency, pub/sub delivery, and more. These can be viewed in Grafana using Dapr's published dashboard templates.
Phoenix / OpenInference Compatibility Dapr Agents follows OpenInference semantic conventions and uses a dual-emit pattern, so agent traces render directly in Arize Phoenix without custom mapping. This is extremely useful if your team already uses Phoenix for LLM observability.
These signals are necessary — but not sufficient when debugging complex agent systems in production.
When you're running multiple agents across different frameworks and something goes wrong, you don't want to write PromQL queries. You want answers. That's what Diagrid Catalyst provides.
Understanding your agent workloads
You've deployed the multi-agent, multi-framework event planner to Catalyst, and now you need to understand what you're running and whether it's healthy.
In this example, all agents (LangGraph, Dapr Agents, Google ADK, etc) are made durable via Dapr Workflow, and their interactions emit the telemetry that Catalyst uses to reconstruct the system topology and visualize how agents are connected in practice.
How are they connected?
Open the call graph. All eight agents are visible with an identity (nodes), each automatically classified as agent framework, durable workflow, or both — so you can tell at a glance what kind of workload each agent is without inspecting them individually. Giving agents identities is powerful since then you can have authN, authZ and encryption, but that is a whole other topic which you can read about here.
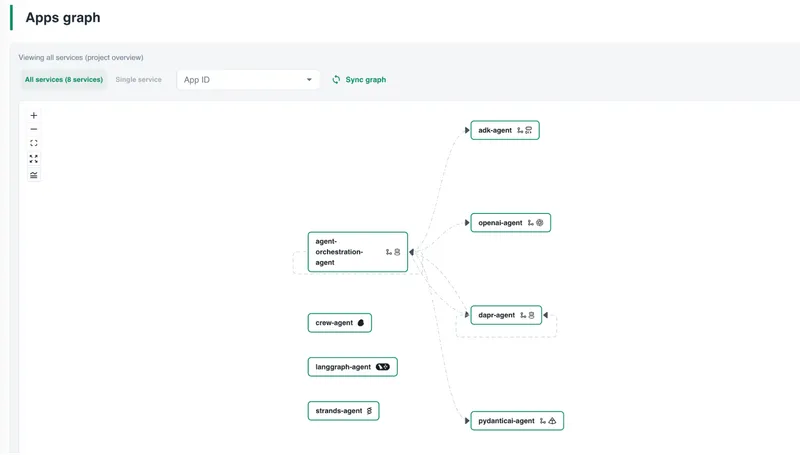
Click into the orchestrator agent and you see the actual topology: agent-orchestration-agent delegates to specialist agents through a pub/sub broker, persists workflow state, and registers agents in the shared registry. These calls are derived from live telemetry — they reflect what's actually happening, not what an architecture diagram intended.
Each call carries live metrics: error rate, P95 latency, and request rate. Red calls mean errors on that path. You're seeing the real orchestration flow before opening a single log or drilling into a failure.
Are the calls healthy?
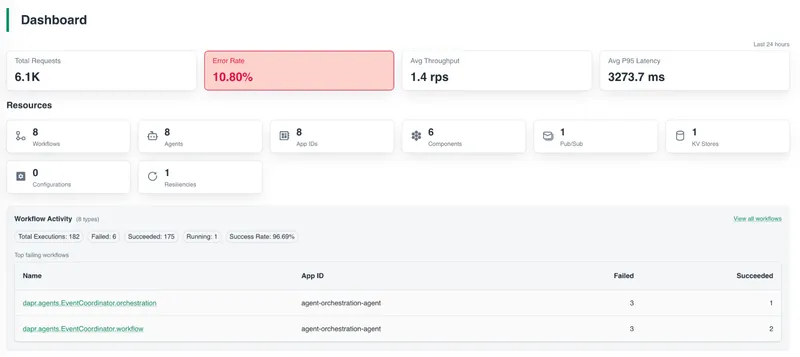
In Catalyst, the metrics overview surfaces these signals across all running agents. These views are derived from the underlying telemetry emitted by the agents at runtime.
Each agent is represented by an app ID (the runtime identity for each agent service as mentioned above), so you can view all eight agents — including total requests, throughput, error rate, and P95 latency for each.
At a glance, you can see which agent has the highest error rate, which has the worst latency, and which is generating the most traffic.
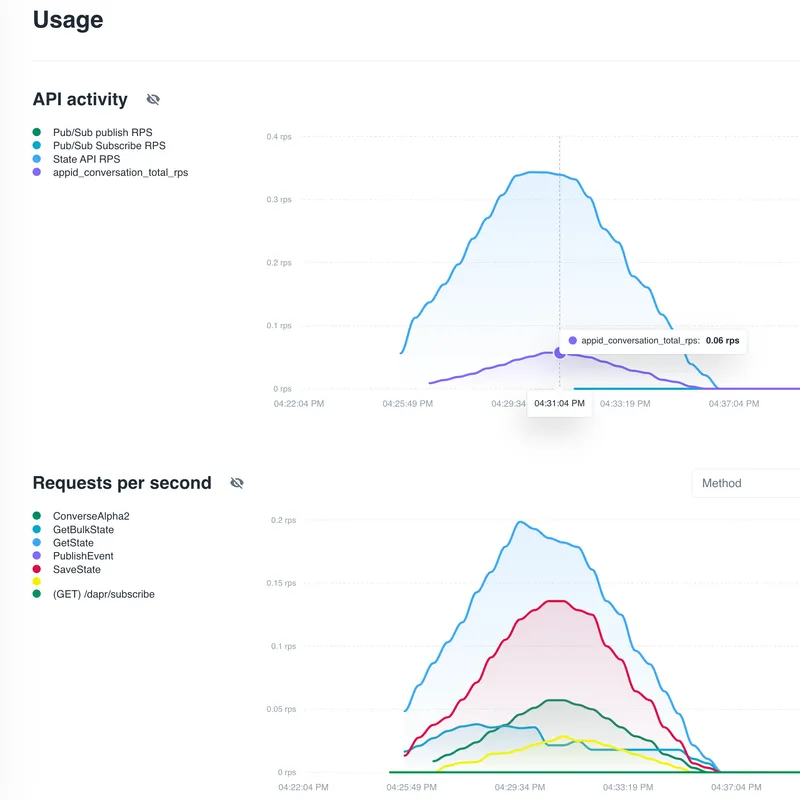
Drill into any agent app ID and you get its full API breakdown. For example, the orchestrator's usage page shows the underlying LLM traffic (Dapr's Conversation API calls), along with pub/sub publish and subscribe rates, state store operations, and per-method request rates.
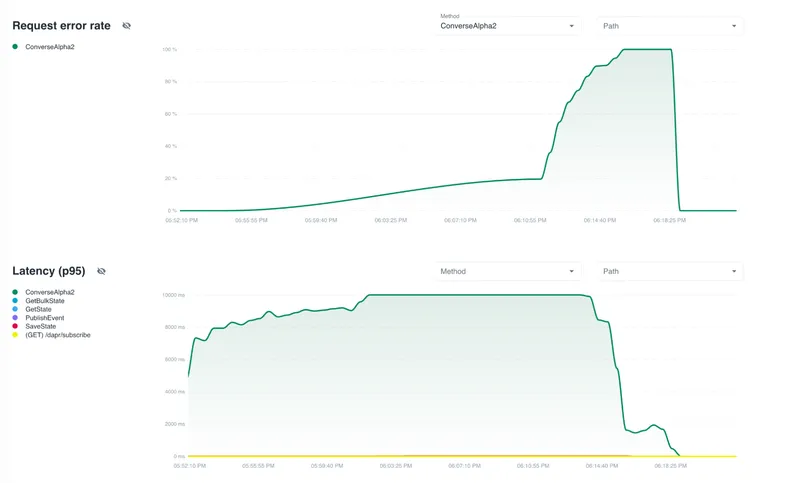
Let's walk through a concrete example of how you can use Catalyst to debug a latency issue in a multi-agent system.
As you drill down, the picture becomes clearer. The Request Error Rate chart isolates errors by API method — and the Conversation API is spiking to nearly 100%. The Latency chart confirms it: Conversation API P95 latency hit 10 seconds before the calls started failing outright.
This points to the LLM provider as the bottleneck — not the state store, not the pub/sub broker.
Debugging a failing workflow
We triggered a few orchestrations and some of them failed. Here's how you'd find the root cause.
Open the Workflows page. You can see all executions across the project, with status, app ID, start time, and duration. Two dapr.agents.EventCoordinator.orchestration executions show up as FAILED.
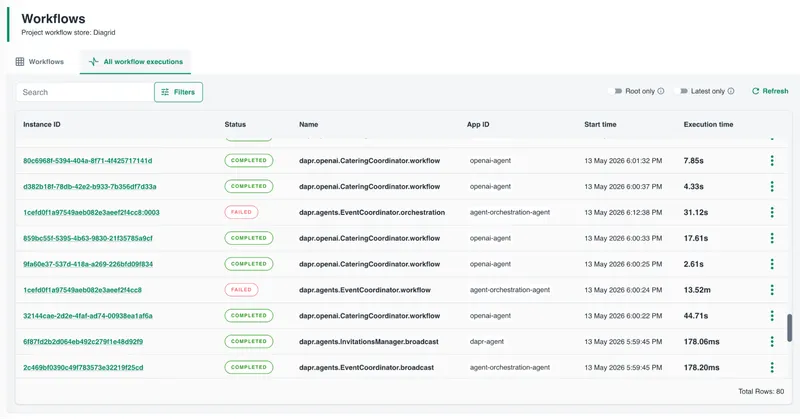
You don't know why yet. Click into one.
The execution detail page shows three views. Start with the graph — a visual DAG of the workflow. Each node is a step: LLM calls, agent delegations, synthesis. Nodes are color-coded by status. You can see at a glance that the workflow reached a call_llm step and failed there.
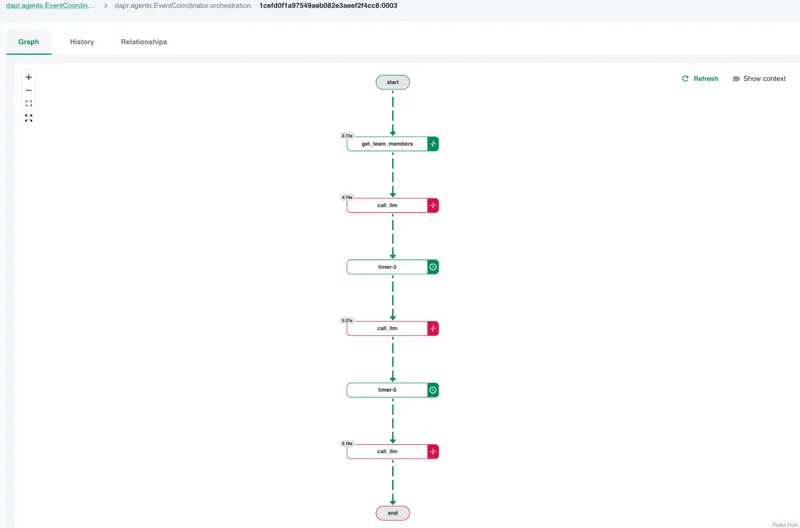
Click the failed node. The step detail shows its input, output, error message, and execution time. The error reads:
failed conversing with component llm-provider:
API returned unexpected status code: 429:
You exceeded your current quota, please check
your plan and billing details.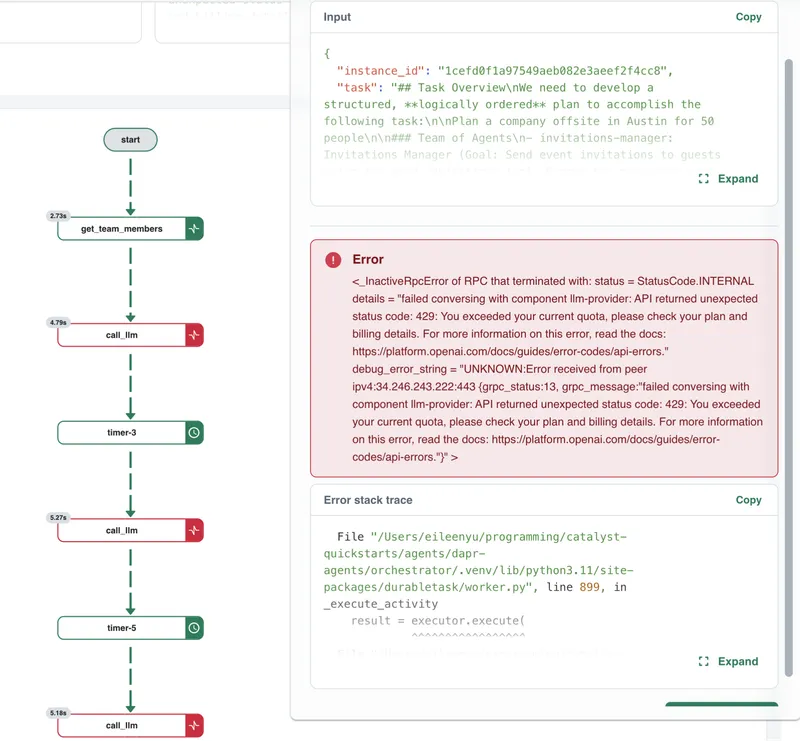
Now you know what failed (the LLM call) and why (a 429 error from the LLM provider). Depending on the provider, this can indicate either a rate limit or quota exhaustion.
Expand the stack trace to see exactly where in the code it originated.
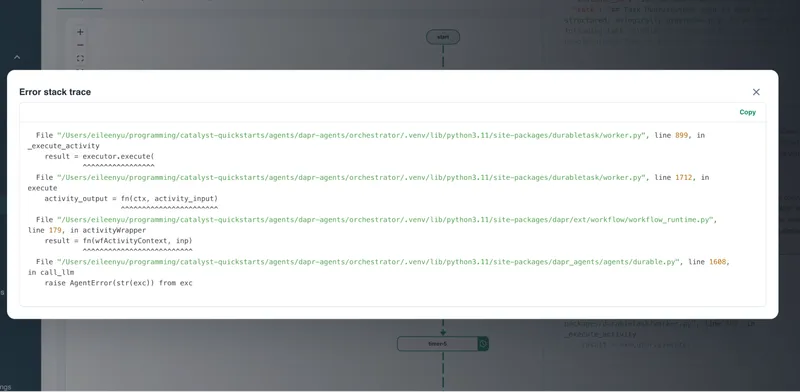
The picture is now clear: seven agents sharing a single OpenAI API quota overwhelmed the token-per-minute limit during concurrent orchestration.
This isn't caused by Dapr — it's a common failure mode when multi-agent systems scale and issue concurrent LLM requests. Dapr's durability provides reliable execution and telemetry, and Catalyst makes that failure visible and easy to diagnose.
Without this level of insight, these issues often surface as sporadic errors with no obvious root cause.
Fix it
The fix paths depend on the type of limit you're hitting:
- If this is a rate limit (TPM/RPM), add retries with exponential backoff or reduce concurrency by staggering delegations
- If this is a quota exhaustion issue, increase your quota or adjust usage (for example, reduce token usage or distribute load across providers)
- For production systems, consider combining both approaches with a Dapr resiliency policy and load distribution
Catalyst doesn't just surface the failure — it helps you distinguish between these cases, so you can apply the right fix.
What's Next
This failure raises a broader question: how much are your agents actually consuming — in tokens and in cost — over time?
In this example, the issue surfaced as a quota exhaustion error. But in practice, these limits are often hit gradually, as multiple agents scale up and issue concurrent requests.
The underlying signals are already there. In this example, Dapr captures token usage, request patterns, and execution traces as part of the workflow.
Surfacing that in Catalyst — per agent, per execution, and over time — is a natural next step.
With that visibility, you can move from reacting to failures to proactively managing them:
- understanding which agents are driving usage
- optimizing model selection and prompt design
- distributing load across providers before limits are hit
Observability doesn't just help you debug failures — it helps you prevent them.
As agent ecosystems continue to diversify, the operational challenge becomes less about which framework you're using and more about whether you can reliably understand, debug, and operate complex agent systems in production.
Try it yourself
You can reproduce the Catalyst views shown in this post with minimal setup by cloning the multi-agent orchestration quickstart, running it with the Diagrid CLI, and opening the Catalyst console. The call graph, metrics, and workflow execution detail are generated automatically from your running agents — no additional Catalyst configuration required.
To reproduce a failure similar to the one shown here, trigger several orchestrations concurrently or lower the LLM provider quota/model limit in your environment. The exact error may vary depending on your provider and quota, but Catalyst will surface the failed workflow step, error message, and related metrics in the same way.
You don't need to add custom instrumentation to get these signals. Enable AgentObservabilityConfig in your Dapr Agent, and the Conversation API metrics, workflow execution history, and OpenTelemetry traces will flow automatically.
Sign up for Catalyst Cloud for free and deploy your first multi-agent system in under 10 minutes.
Ready to Go to Production?
Add durable execution to your AI agents in minutes. Start free, no credit card required.