Announcing the Diagrid Dev Dashboard for Local Dapr Development
The Diagrid Dev Dashboard is a free, open-source companion for local Dapr development. Get a live view of your running apps, inspect and debug workflows, and build components and resiliency policies without hand-writing YAML.

Marc Duiker
Developer Advocate
Introduction
Building Dapr applications locally means dealing with multiple processes at the same time which can make it difficult to understand what's going on. You check one terminal for your application logs, another for the sidecar, and you keep a mental map of which app is on which port. When a component does not load the way you expected, you need to find the YAML component files and investigate deeper. Workflows adds another layer of debugging complexity. A Dapr Workflow is long-running and event-sourced, so its state lives as a history of events in your state store, and finding out why an instance stalled has meant querying the state store by hand, remembering CLI commands, or adding log statements and running it again.
The original Dapr dashboard used to cover some of this ground, but it is now deprecated and no longer maintained. It also predates several important Dapr features, so it has no view into modern capabilities such as workflow inspection.
The new Diagrid Dev Dashboard fills that gap. It is free and open source, runs as a single binary on your machine, and gives you a live view of everything Dapr running locally. Whether you start your apps with dapr run, .NET Aspire, Docker Compose, or TestContainers, it shows your running apps, components, actors, pub/sub subscriptions, resiliency policies, and control plane services in one place, with no extra configuration. Its standout capability is workflow debugging. If you are developing Dapr Workflows, you can list executions, inspect their event history and input and output, and terminate or purge stuck instances, all from your browser. This post walks through what the dashboard does and how to get it running in a couple of minutes.
What the Dev Dashboard gives you
Workflow debugging
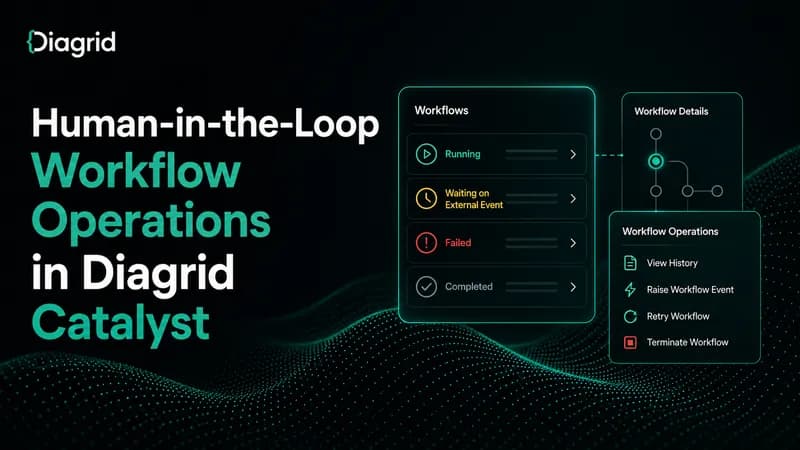
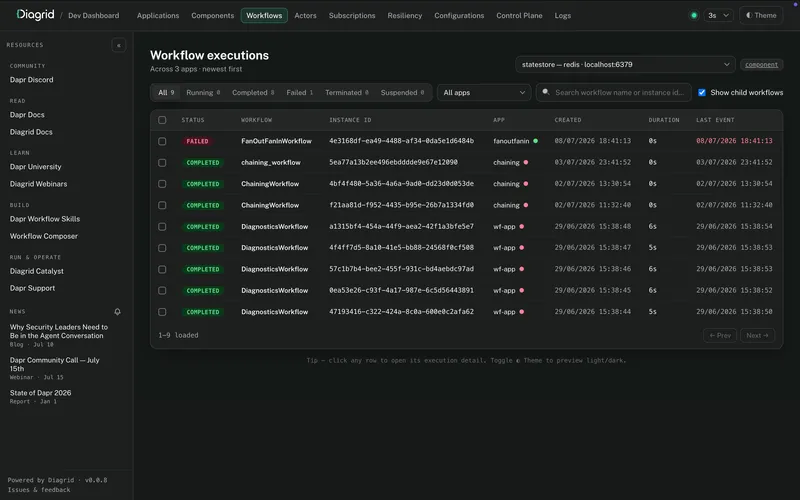
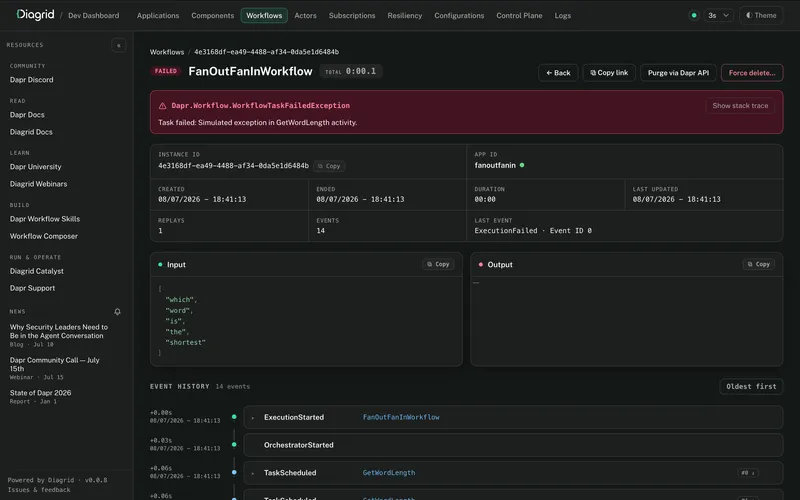
The dashboard lists workflow executions across all your running apps, and you can filter them by status to find the one you care about. Open an instance and you see its event history in real time, along with the input and output of each step, so you can trace exactly where a workflow went off course. When you need to reset, you can terminate, purge, or force-delete instances one at a time or in bulk. The data comes straight from your local state store (Redis, PostgreSQL, SQLite, or MongoDB), or through the sidecar's gRPC API for containerized stores, so what you see is the real state, not a copy. If you want a refresher on how the engine records that state, see authoring Dapr Workflows in .NET.
Live application monitoring
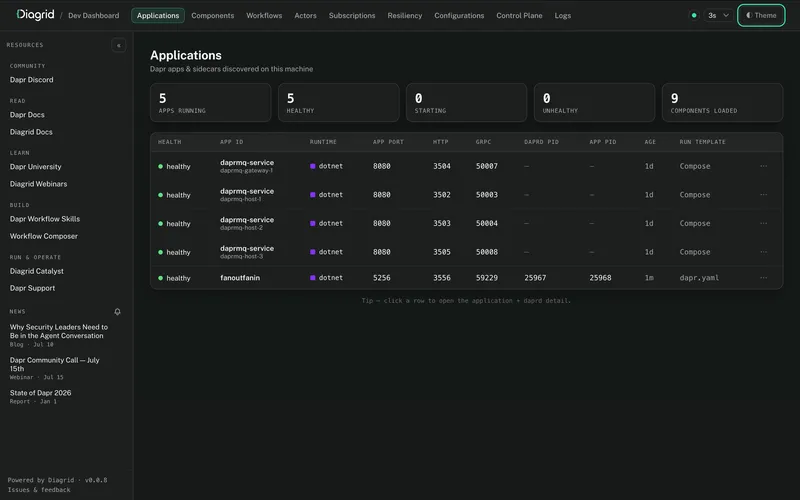
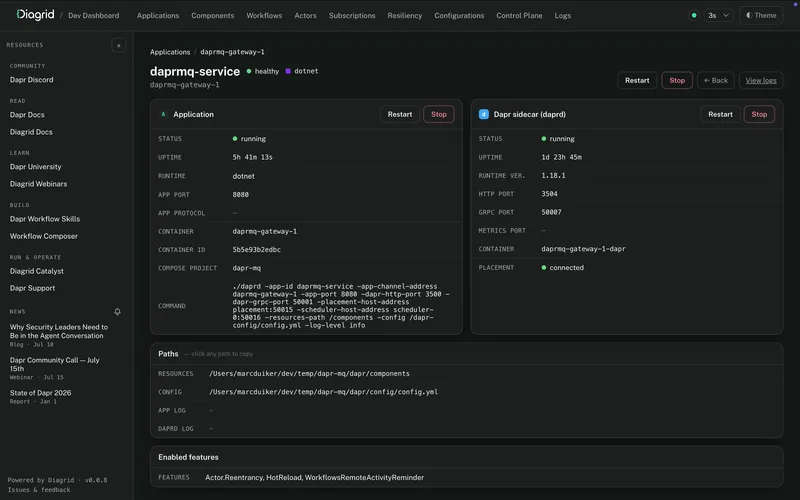
The main view is a live table of every Dapr app the dashboard finds, with health status, ports, process IDs, and runtime information. Select an app to open a detail page that shows its loaded components, actor types, and pub/sub subscriptions, so you can confirm at a glance that everything registered the way you intended.
Builder wizards
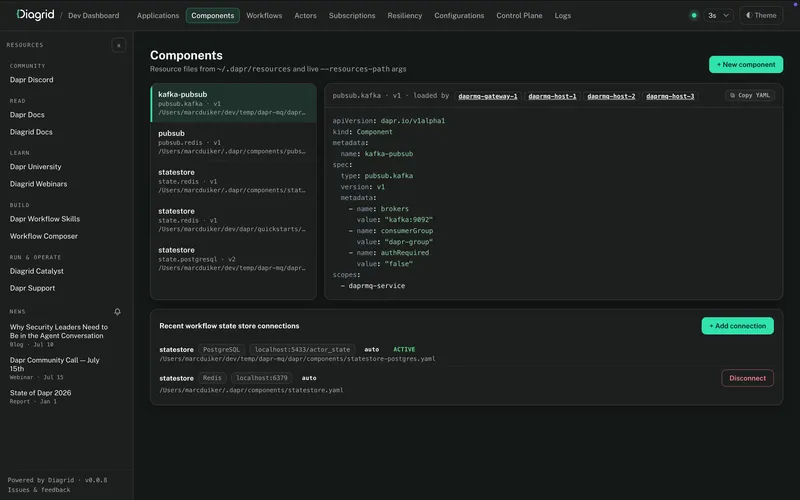
Two guided builders take the guesswork out of YAML. The Component Builder lets you configure Dapr components visually from the full component catalog, with authentication profiles handled for you, instead of hand-writing definitions. The Resiliency Builder walks you through retry, timeout, and circuit breaker policies and produces valid resiliency configuration.
Live log tailing
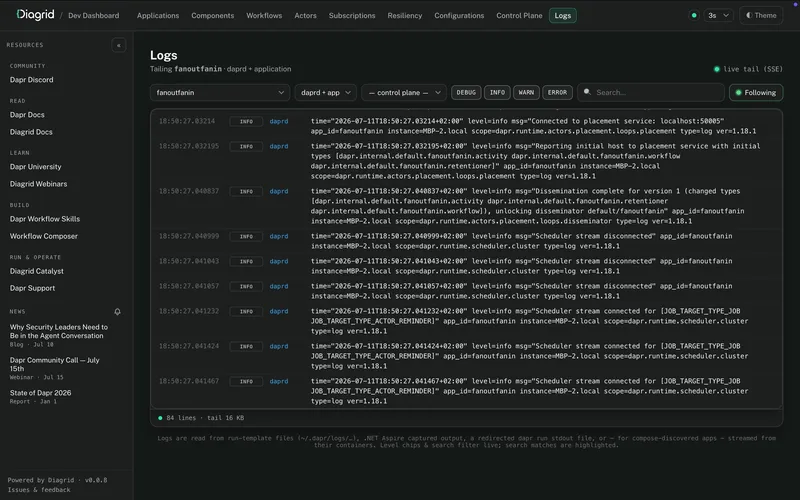
You can stream sidecar and application logs directly in the dashboard, with log-level coloring and keyword highlighting. That keeps the output you need in the same window as the app and workflow views, instead of scattered across terminals.
Broad discovery
The dashboard finds your apps automatically, no matter how you run them. It discovers processes started with dapr run and dapr run -f, .NET Aspire AppHosts, Docker Compose setups with Dapr sidecars, and Dapr Testcontainers. You can also scope discovery to a single source when you want to focus on one workflow.
How to get started
You need a working Dapr installation first, so run dapr init if you have not already.
On macOS or Linux, install the dashboard with a single command:
curl -sSL https://raw.githubusercontent.com/diagridio/dev-dashboard/main/scripts/install.sh | shOn Windows, use the PowerShell script instead:
iwr -useb https://raw.githubusercontent.com/diagridio/dev-dashboard/main/scripts/install.ps1 | iexOnce it is installed, start your Dapr apps as you normally would, then run:
diagrid-dev-dashboardThe dashboard opens in your browser at http://localhost:9090. Pass --port if that port is taken. Keep in mind that it is built for local development only. It has no authentication or multi-user support and is not meant for Kubernetes, staging, or production. For the full command reference and discovery modes, see the Dev Dashboard documentation.
Summary
The Diagrid Dev Dashboard pulls your local Dapr development into one live view. You get real workflow debugging with full event history and instance control, a running list of your apps and their components, guided builders for components and resiliency policies, and log tailing in the same window. It is free, open source, and installs as a single binary, so you can add it to your existing local setup without changing how you run your apps.
Give it a try on when you're developing and testing your Dapr applications. Once you have it running, come share how it works for you in the Dapr Discord. If you hit a bug or have an idea to make it better, open an issue on the dev-dashboard repository.