Observability for Non-Deterministic Agent Workflows
When an agent fails overnight, the record is already there. Diagrid Catalyst captures each step and the identity behind it from the runtime, with no instrumentation to maintain.

Jani Janakiram, MSV
Guest Author
The previous post in this series closed the identity story. An agent can now prove who it is and leave a signed record of what it did. It ended on a question a platform team inherits the moment agents reach production.
The core challenge in non-deterministic agent workflows is understanding unexpected behaviors, especially when issues occur at odd hours. This post emphasizes why observability is essential for diagnosing such failures.
Why Not an Agent-Observability SDK
Traditional application monitoring, like request-response APM (Application Performance Monitoring), assumes predictable request flows, which do not match the non-deterministic nature of agent workflows. This mismatch explains why such tools fall short, highlighting the need for specialized observability solutions.
A purpose-built agent-observability category has existed for roughly two years, precisely because teams hit that wall. The tools in it are capable and widely used. LangSmith, Langfuse, Arize Phoenix, Braintrust, Datadog's LLM Observability, and others already record agent runs as step-level traces, evaluate intermediate steps, and let a team debug multi-step chains. If you want to understand how these tools can help you overcome real challenges, consider how they outperform traditional methods.
Instead of asking why avoid APM, the real question is why prefer dedicated observability tools over instrumenting agents with SDKs. This post explores that choice, providing clear guidance for platform teams considering their options.
Signals From the Runtime, Not the Agent Code
Nearly every incumbent agent-observability tool works by instrumenting the application. A team adds an SDK, a decorator, or a callback handler to the agent, and the tool captures what flows through it. That works, but it also means ongoing effort to add, maintain, and ensure consistency across agents and frameworks. Highlighting broader coverage with runtime-based methods can help you feel more capable and less overwhelmed by maintenance tasks.
Diagrid Catalyst captures the run from underneath. Catalyst is the enterprise platform for durable execution and secure agent communication, built on the open-source Dapr runtime, a graduated CNCF project. Because the data plane handles the model and tool calls, the instrumentation lives in the Dapr runtime rather than in the agent. A team turns on agent observability, workflow history, LLM metrics via the Conversation API, and OpenTelemetry (OTEL) traces flowing across LangGraph, Dapr Agents, CrewAI, Google ADK, the Microsoft Agent Framework, or an agent reached through an MCP server. This runtime-based approach offers a more comprehensive and less intrusive way to observe both deterministic and non-deterministic workflows, when compared to SDK instrumentation, which can miss context.
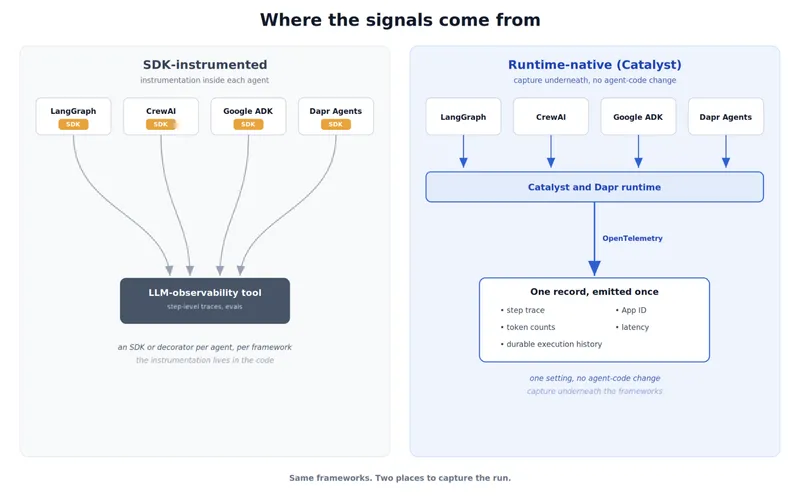
That is a different claim from also emitting step-level traces. The record is a property of where the work runs, not of how the agent was written.
One Record, Not a Fourth Silo
The second answer is what the record contains. An LLM-observability tool gives a trace of the reasoning. It does not know which workload was acting, and it stands apart from the runtime that executes and recovers the agent.
Catalyst writes the workflow history as events, step by step, as the durable runtime runs the agent. That history is a telemetry path, separate from the recovery state the runtime persists to a workflow state store such as Postgres, Azure Blob Storage, DynamoDB, or CosmosDB and replays to resume a crashed run from its last completed step. Both paths describe the same execution, so the observability record reflects the durable run rather than a reasoning trace assembled beside it. Every step, every model call, and every tool invocation is captured with its inputs and outputs.
The payoff is organizational, not only technical. Finance, engineering, and security teams can rely on a single, consistent record instead of multiple reconciling reconstructions. A team that adopts a standalone LLM-observability tool gains a unified view, with Catalyst integrating those insights into the runtime's existing record, adding strategic value.
Debugging a Failed Run
Signals are necessary without being sufficient on their own. When several agents run and one misbehaves, a platform team wants an answer rather than a session spent piecing one together from raw metrics and logs. Catalyst turns the signals into an operational view, and Diagrid's debugging walkthrough traces this same kind of failure through the console step by step.
Part of the difficulty is structural: an agent has a non-deterministic execution path, so there is no canonical trace to diff a failed run against.
The running example throughout this series is a support agent that handles a refund ticket in five stages. Classify the ticket, retrieve the account, draft the refund, notify the customer, close the case.
The App Graph reconstructs the project's live topology from the telemetry the sidecar emits. Each App ID appears as a node, classified automatically as an agent framework, a durable workflow, or both; each edge is weighted by call volume and carries its error rate, P95 latency, and request rate. It shows what the agents are doing at runtime, not what an architecture diagram intended. The Metrics page lists every agent by App ID with request volume, throughput, error rate, and latency percentiles, so the worst latency or the highest error rate is visible at a glance.
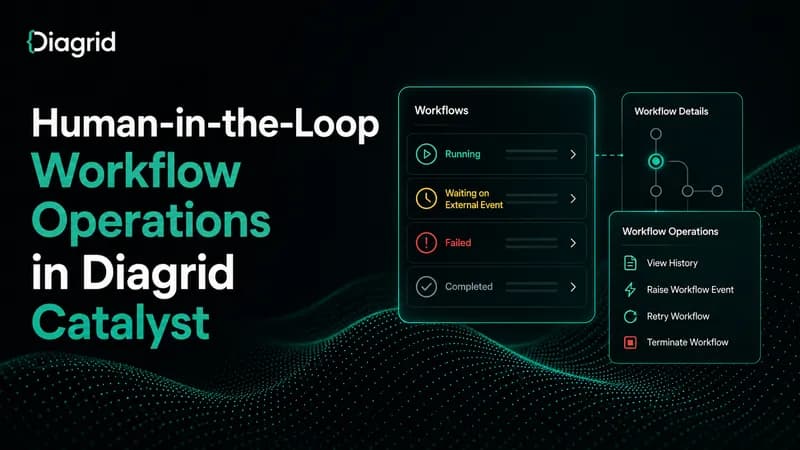
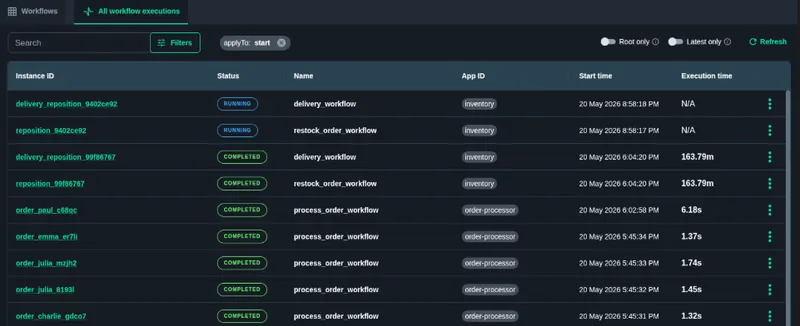
Imagine the refund agent starts failing intermittently overnight. The Workflows page lists every execution with its status, App ID, start time, and duration, and the failed runs stand out.
Open one and the workflow visualizer renders the run as a step-by-step graph, color-coded by status, with inputs, outputs, and durations at each step.
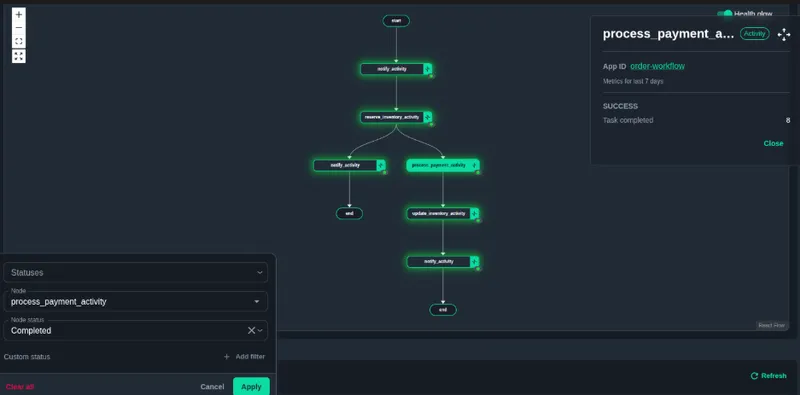
The workflow reached the draft-refund step and stopped there. Click the failed node, and the step detail shows its input, its output, the error message, and how long it ran.
The error is a 429 from the model provider, a quota or rate limit exceeded during concurrent runs. The latency chart reports the Conversation API spiking toward a 100 percent error rate, with P95 latency reaching ten seconds before the calls failed outright. That points at the model provider as the bottleneck rather than the state store or the message broker. An expandable stack trace shows where in the code the call originated. By breakfast, the platform team knows what failed, the draft step, and why: the provider limit, instead of a forensic reassembly from scattered logs.
None of that walkthrough required custom instrumentation. It came from turning one setting on.
Additive, Not a Replacement
Catalyst runs alongside the tools a team already has. It emits standard OpenTelemetry, and its observability model exports traces to any OTLP backend already in place, including Datadog, New Relic, Honeycomb, Grafana Tempo, Jaeger, or a customer-run OpenTelemetry Collector. A team sets the sampling rate and the endpoint on a configuration resource, and the platform handles the rest. On Catalyst Cloud, metrics and API logs stay queryable in the console and the control-plane API, while a self-hosted data plane forwards every signal through a collector the team controls.
Teams that run a dedicated LLM-observability tool can keep it. Reasoning-quality evaluation, comparing prompts and scoring intermediate steps, is what those tools are built for, and Catalyst does not reproduce it. The two layers answer different questions: an LLM-observability tool whether the agent reasoned well, and Catalyst whether the run executed, who acted, and what it cost, so most production teams run both.
Dapr Agents fit that pairing with no extra wiring. They emit traces in OpenInference, an open convention for describing LLM and agent calls that tools like Arize Phoenix read natively, so their traces appear in Phoenix with no custom mapping. Agents on other frameworks still export the same runtime-native traces over OTLP to whatever backend a team runs, and the OpenInference path is the extra convenience Dapr Agents add.
For a security reviewer, this observability layer exists alongside the verifiable-execution work from the previous post, which gives every step a signed, tamper-evident record.
SDK-Instrumented vs Runtime-Native Observability
There are two ways to get step-level agent observability today. A team either instruments the application or captures from the runtime underneath it. The table below sets the two approaches side by side, and the qualifications matter as much as the rows.
| Requirement | SDK-instrumented agent observability | Runtime-native (Catalyst) |
|---|---|---|
| How signals are captured | Usually an SDK, decorator, or callback in the agent code, though some tools add a proxy or auto-instrumentation option | Emitted by the sidecar in the data plane, with no change to agent code |
| Framework coverage | Per-framework integration that varies in depth and overhead | One runtime setting across LangGraph, CrewAI, Google ADK, Dapr Agents, and MCP servers, among others |
| Identity on each record | A trace of the reasoning, where the acting workload is usually not named | Each record carries the originating App ID |
| Cost attribution | Depends on the tool, and often a separate concern | Input and output token counts ride on the span, per step |
| Tie to durable execution | Generally unaware of the runtime's persisted recovery history | Drawn from the same execution history used to recover a crashed workflow |
| Reasoning-quality evals | A core strength of the category, in tools such as LangSmith, Phoenix, and Braintrust | Not the focus, and exported to those tools over OTLP or OpenInference |
| Export | Tends toward its own backend | OpenTelemetry into any OTLP backend already in place |
Reasoning-quality evaluation is where the SDK-instrumented tools are strong, and Catalyst exports to them rather than reproducing that work. What runtime-native capture adds is the layer they do not reach: the identity of the acting workload and the durable execution history, captured without touching the agent.
One Capture, Three Teams
That single record earns its place across three teams. One captures answers a platform team's failure question, a security team's provenance question, and a finance team's spend question, with no separate tool wired into each agent. The platform engineer moves from reacting to an overnight page to running a query. Security reads the same identity-tagged history the access controls already produced, and finance reads the per-step token counts its cost model needs.
Observability for agents is less about watching a dashboard than about holding the evidence when something goes wrong. Catalyst captures the steps, the identities, and the token counts as the events happen, from the runtime rather than from instrumentation a team maintains. The overnight incident becomes a query against a record rather than a reassembly from partial logs, and the same evidence that explains a failure usually points to the fix. None of that asked the team to rewrite the agent. That is where the next post picks up, keeping the framework you already chose and adding the production infrastructure underneath it.