10 New Dapr Ops Dashboard Features That Make Dapr Operations Easier
Dapr Ops Dashboard simplifies the running of Dapr at scale, provides expert guidance, helps improve performance, bolsters security, and eliminates downtime. These ten new features make Dapr Ops Dashboard even more valuable to SREs, Platform teams, and developers.

Bilgin Ibryam
Principal Product Manager
TLDR
- See how your Dapr apps connect and where latency or errors build up through the Apps Graph and a component-centric view.
- Judge application health in one place, combining pod status, critical logs, metric alerts, component initialization, and advisories.
- Configure timeouts, retries, and circuit breakers with the Resiliency Builder, then watch circuit breaker state changes over time.
- Find root causes faster with Dapr 1.15 error codes and a notifications list you can filter to active issues.
- Track the Scheduler Service and jump to any cluster, app, or component with Quick Find.
While our Diagrid OSS team has been busy working on Dapr 1.15 - our product team hasn't been sitting idle. We've been taking Dapr 1.15 capabilities and making them operational through Dapr Ops Dashboard. Whether you're already running critical Dapr services in production with Dapr Ops Dashboard, or haven't tried it yet, these 10 new features will change how you think about operating Dapr applications.
We have also updated the Dapr Ops Dashboard trial experience, and you can now enjoy a full month of fully-featured Dapr Ops Dashboard, after which you can either benefit from our free tier or upgrade to an enterprise subscription.
Let’s dig into those 10 new features:
1. Identify Bottlenecks Fast with Apps Graph 2. Isolate Components for Infrastructure Insights 3. Monitor Application Health Holistically 4. Take Control of Failures with the Resiliency Builder 5. Track Circuit Breaker State Changes 6. Debug Faster with Dapr Error Codes 7. Filtering Alert Noise 8. Scheduler Service Support 9. Quick Resource Navigation (⌘/Ctrl + K)
1. Identify Bottlenecks Fast with Apps Graph
Monitoring distributed applications requires significant investment in observability infrastructure—from collecting metrics, instrumenting your code for network tracing, logs, and correlating that with deployment metadata and understanding application context. Plus, generic monitoring solutions have no understanding of Dapr’s view of the world through its APIs and infrastructure abstraction.
With the Dapr Ops Dashboard Apps Graph, automatic discovery and service mapping, dependency tracking, and built-in telemetry correlation come out of the box, and we've made it even better! By leveraging Dapr's built-in telemetry and additional intelligence, Apps Graph provides a real-time visualization of your Dapr-enabled applications that requires zero additional instrumentation. The graph allows you to filter apps by namespace and overall health, and further drill down into specific problematic areas by isolating an app to analyze individual services and their dependencies.
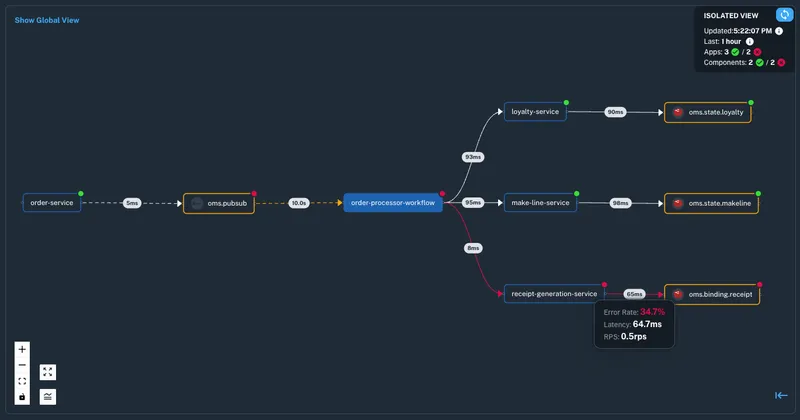
The Dapr Ops Dashboard Apps Graph
As you can see from the isolated app view, it shows near real-time latency across all service and infrastructure dependencies at a glance. At the top, there are stats of all apps and components by health status. Each incoming and outgoing connection shows p95 latencies, error rate, and RPS from the last hour for each app.
When something goes wrong, you don’t have time to piece together logs. The Apps Graph highlights slow or failing calls at a glance, helping you diagnose issues faster. You can instantly access networking metrics, logs, advisories, and related metadata without switching tools. Whether you're debugging an outage or onboarding a new engineer, this feature provides a single pane of glass for your Dapr deployment.
2. Isolate Components for Infrastructure Insights
Dapr applications and components are two sides of the same coin. While an application-centric view helps track service dependencies and interactions, sometimes you need to flip the perspective and look at your architecture through an infrastructure lens - especially when troubleshooting performance issues or resource usage.
Now in Dapr Ops Dashboard, you can switch to a component-centric view with a single click. By isolating a Dapr component, you instantly see all applications interacting with it, complete with detailed performance metrics. For instance, when investigating an overloaded message broker, you can quickly identify which applications are publishing too aggressively or which subscribers are falling behind in message processing.
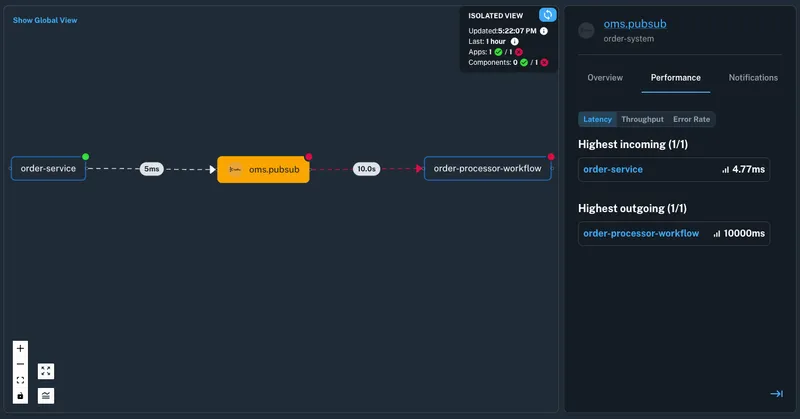
The new component-centric view in Dapr Ops Dashboard
The isolated component view provides operational insights at a glance:
- Component health status through initialization checks
- Incoming and outgoing request metrics (latency, error rates, throughput)
- Active critical alerts and Notifications
- High-impact advisories for configuration issues and recommendation
Whether you're investigating an overloaded message broker and looking to find which app is abusing it, or ensuring proper component usage across your architecture, the component network view offers a perspective centered on your infrastructure. This makes it easier to spot resource bottlenecks and optimize component configurations across your entire system.
3. Monitor Application Health Holistically
When operating distributed systems, determining application health is more nuanced than a simple "up" or "down" status. Is an application truly healthy if its Pods are running but failing to connect to message brokers? What if it's throwing errors in logs while reporting as "Ready" to Kubernetes? The reality is that application health is multi-dimensional, especially in distributed architectures.
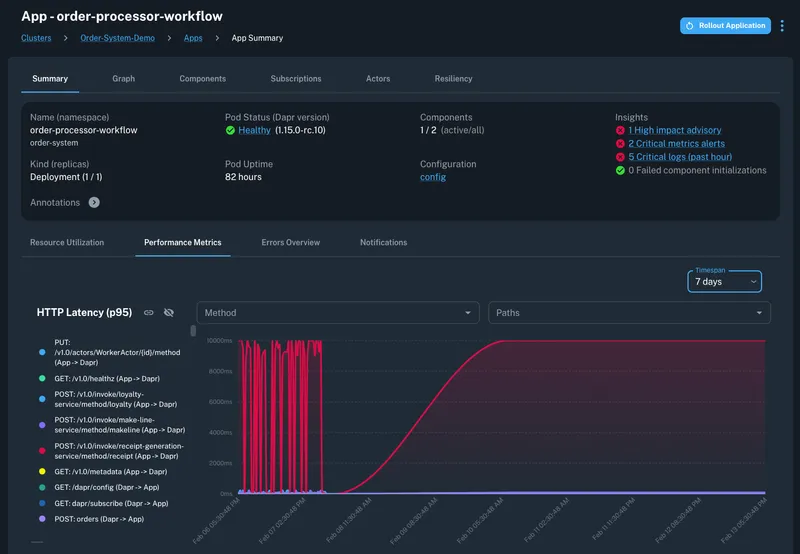
The Dapr Ops Dashboard App Summary provides rich context on application health
The enhanced Application Summary in Dapr Ops Dashboard now provides a consolidated health dashboard that brings together all these perspectives in a single view. It aggregates health signals across multiple dimensions:
- Pod Status: Traditional Kubernetes health checks for both app and Dapr sidecar containers
- Critical Logs: Error conditions detected in the sidecar logs
- Metric Alerts: Performance degradation and availability threshold violations
- Component Initialization: Connectivity status to backing infrastructure services
- Advisories: Misconfigurations and security best practice violations
The new summary view doesn't just aggregate these signals - it makes them actionable. Each health indicator links directly to a detailed historical graph for investigation. One click takes you to resource utilization trends, networking performance metrics, error logs, or advisory details. Whether you're troubleshooting an incident or performing a health assessment, this view provides a complete operational picture of an application.
4. Take Control of Failures with the Resiliency Builder
If you've operated distributed systems, you know the drill - every network call is a potential point of failure. While Dapr provides powerful resiliency features through timeouts, retries, and circuit breakers, configuring them correctly is up to you. A single misconfiguration in these policies can lead to cascading failures across your system.
During development, engineers must craft these configurations for local development, but when it's time to deploy to staging or production, platform teams often need to adjust these policies for different environments. Getting these configurations right is crucial - too aggressive retries can overwhelm struggling services, while overly cautious timeouts can degrade the user experience.
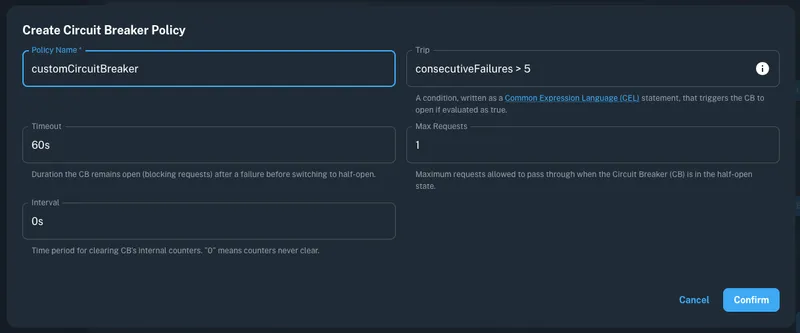
Dapr Ops Dashboard Resiliency Builder interface
That's why we've added the Resiliency Builder to Dapr Ops Dashboard, complementing our existing Component Builder that helps configure Dapr components for various infrastructure services like Redis, Kafka, and others. The Resiliency Builder provides a guided interface for creating and managing Dapr resiliency policies, with features like:
- Parameter validation to prevent common configuration mistakes
- Auto-completion for apps, actors, and components
- Built-in documentation for each configuration option
- Support for complex policy combinations and dependencies
Some of the cool features are the ability to easily override Dapr's default retry policies and the ability to set the new error code-based retry triggers where you can now specify exactly which HTTP or gRPC error codes should be retried.
Whether you're setting up timeouts to fail fast, configuring retries with exponential backoff, or implementing circuit breakers to prevent cascade failures, the Resiliency Builder helps you get it right. Check out this blog post to learn more about creating resilient Dapr applications.
5. Track Circuit Breaker State Changes
Introducing resiliency policies is a good first step - but the next challenge lies in understanding how these policies behave in production. While you can test timeout and retry scenarios in development, reproducing real-world cascading failures is nearly impossible. Without proper visibility into how your circuit breakers are performing, you're essentially operating in the dark.
Dapr Ops Dashboard provides visibility into resiliency policy activations by showing how often your timeouts, retries, and circuit breakers are triggered over time. These metrics help identify services experiencing transient failures and validate whether your resiliency configurations are effectively handling these issues.
Building on this foundation, Dapr Ops Dashboard now added even deeper visibility into circuit breaker behavior through new state transition metrics available in Dapr 1.15. These enhanced visualizations show the complete lifecycle of your circuit breakers - from normal operations (closed state) to tripped (open state), and recovery attempts (half-open state).
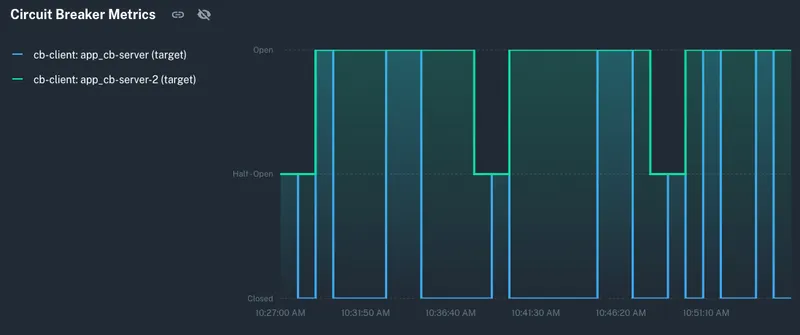
Dapr Ops Dashboard Circuit Breaker status metrics
These visualizations help you:
- Identify services that frequently hit transient failure thresholds
- Track how long circuit breakers stay open, helping tune recovery timeouts
- Correlate circuit breaker trips with other metrics like latency spikes and error rates
- Validate whether your circuit breaker thresholds are appropriate for your traffic patterns
Rather than waiting for user complaints about cascading failures, you can now proactively spot problematic services and tune your resiliency configurations. Resiliency visibility, combined with the Dapr Ops Dashboard Apps Graph and health monitoring, gives you deep visibility into your application's fault tolerance behavior.
6. Debug Faster with Dapr Error Codes
When things go wrong in distributed systems, generic HTTP 500s or gRPC failures don't tell you much. Was it a timeout? A permissions issue? A missing resource? Without detailed error information, you're left digging through logs across multiple services to piece together what happened.
Dapr 1.15 introduced standardized error codes across all its APIs (like ERR_PUBSUB_FORBIDDEN or ERR_STATE_STORE_NOT_FOUND), and Dapr Ops Dashboard now provides deep visibility into these errors through a new graph. The Error Codes Graph gives you historical views of errors occurring in your applications, grouped by API category and specific error types.
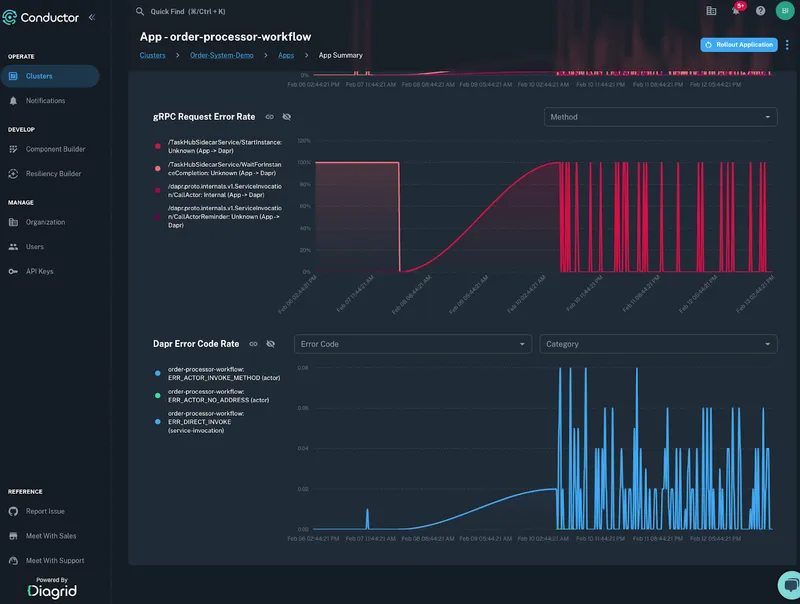
The Dapr Ops Dashboard UI provides new analytics for faster troubleshooting
The visualization shows error patterns across your system:
- Error frequency and trends over time
- Breakdowns by API category (state, pub/sub, service invocation)
This graph helps finding root causes faster. For example, a spike in ERR_PUBSUB_FORBIDDEN errors across multiple services could indicate an access control issue, while ERR_STATE_GET errors might reveal a failing state store. Combined with the Dapr Ops Dashboard Apps Graph, you can quickly identify which services are affected and what components are causing the issues. To find out more, check out Dapr's error code reference.
7. Filtering Alert Noise
For SREs and platform teams, alert fatigue is real. When every service hiccup generates multiple notifications, critical issues can get lost in the noise. While comprehensive alerting is crucial for reliability, identifying which alerts need immediate attention versus those that have already resolved themselves is essential.
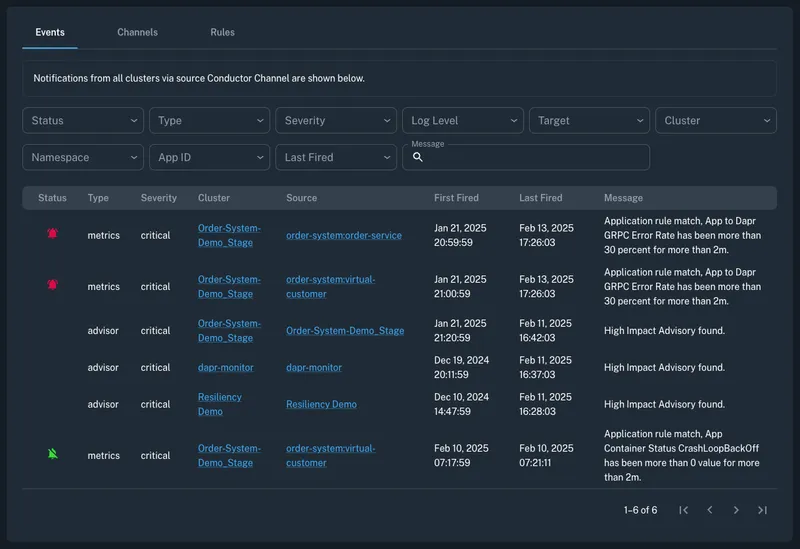
Example of how the Dapr Ops Dashboard Notifications is optimized to focus on critical issues.
The Dapr Ops Dashboard notifications list now includes a status filter that helps you focus on active issues. The status column clearly shows which metric alerts are currently firing versus those that have auto-resolved. For example, when a service experiences latency spikes, you'll see a firing metric alert. Once performance returns to normal, the alert status automatically updates to "resolved" - no manual intervention needed. Each notification links directly to the source that generated it and its relevant graphs. This connection between alerts and troubleshooting data means less time hunting through different tools and faster resolution times.
8. Scheduler Service Support
With Dapr's Scheduler Service becoming GA in 1.15, teams get a more reliable way to manage scheduled jobs and actor reminders. But how do you know if these time-critical operations are running as expected?
Dapr Ops Dashboard now provides visibility into the Scheduler Service through Dapr's control plane monitoring dashboard. As shown in the screenshot, you can track detailed historical data around resource consumption - from precise CPU usage to memory utilization. These metrics help platform teams ensure the scheduler is properly sized and performing efficiently.
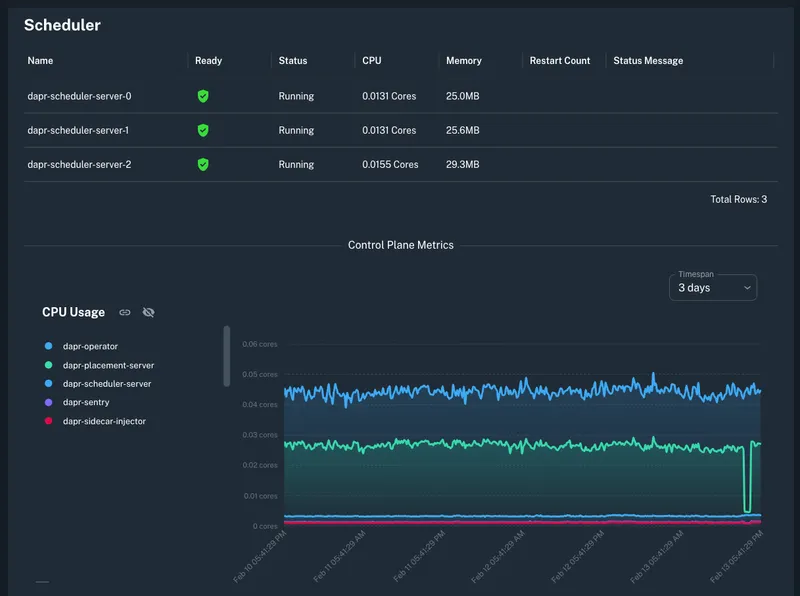
The Dapr Ops Dashboard Scheduler Screen
Beyond these metrics, we're working on providing first-class support for Scheduler in Dapr Ops Dashboard by adding the following in the coming weeks:
- Alerts for tracking scheduler health
- Multiple new advisories for sizing and tuning scheduler for production loads
Whether you're running thousands of recurring jobs or just a few critical reminders, proper scheduler monitoring is essential. Stay tuned for additional features coming soon.
9. Quick Resource Navigation (⌘/Ctrl + K)
Some Dapr deployments have hundreds of applications spread across different environments. When you know exactly what you're looking for - whether it's a specific app having issues or a state store to check - browsing through multiple clusters and namespaces wastes time.
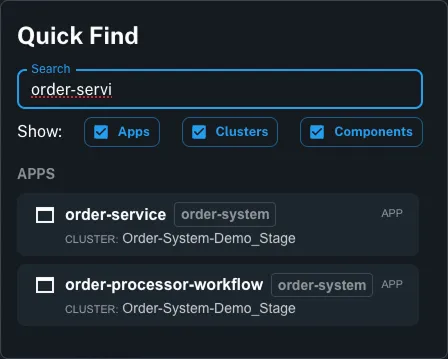
The new Quick Resource Navigation in Dapr Ops Dashboard
The new Quick Find feature (⌘/Ctrl + K) in Dapr Ops Dashboard lets you instantly search across all your clusters, apps, and components from anywhere in the UI. Just start typing the resource name, and Quick Find shows matching results, complete with resource type, namespace and cluster context. Filter by resource type (Apps, Clusters, or Components) to narrow down results, or quickly access recently viewed resources. Want to try it out? Hit ⌘/Ctrl + K in Dapr Ops Dashboard.
No trial clock. No feature gate. No paid upgrade required to get the full Dapr Ops Dashboard experience.