
Tracking Token Usage, Latency, and Cost Across Agents
Traditional monitoring shows agents as healthy while token spend and latency quietly disappear into loops, retries, and tool calls it can't see. This piece breaks down what agent observability actually captures, and where the telemetry has to come from to be useful.
The invoice arrived Monday morning, 40% higher than the month before. Six agents were running in production. Nobody on the team could say with any confidence which one drove the spike or whether the model, a runaway tool call, or a workflow that quietly retried itself three times was to blame.
There were dashboards. Latency was within SLA. Error rates were flat. And yet the money went somewhere, the seconds went somewhere, and none of it showed up on a graph.
This is where a surprising number of AI teams end up. The traditional monitoring stack keeps reporting the system as healthy while the part that actually costs money goes unnoticed. The reason is the agent's behavior between request and response that stays invisible. So the question worth answering isn't whether to add observability. It's what agent observability actually means, and what a team needs in place for token spend and latency to stop being a mystery.
Why the existing monitoring stack goes quiet on agents
Standard APM was built for deterministic services. A request comes in, some code runs, a response goes out, and the key question is whether that round trip succeeded within a given time budget. That model breaks down the moment an agent gets involved.
An agent that loops five times, calls the wrong tool twice, and eventually returns something reasonable will look identical to one that gets the answer on the first try. Both return a 200. Both fall inside the P95 latency band. But one spent four times the tokens and took three times as long to converge. Traditional APM has no vocabulary for that difference because it sees the outside of the box, not what happened inside it.
It's also worth separating two terms that often get conflated. LLM observability is about a single model call. It covers the prompt, the completion, and the tokens used. Agent observability is about the entire path an agent takes to serve a request. It involves multiple LLM calls, tool invocations, retries, and sub-agent handoffs, all stitched together into one coherent execution story. LLM observability is one part of agent observability. It isn't the whole thing.
When leaders ask hard questions about their agent bill, they're really asking three things at once:
- Where did the tokens go: Which agent, which step, which user or task consumed them?
- Where did the seconds go: Is the model slow, or is a tool call the actual bottleneck?
- Which agent, which run, which step is responsible: How do we get from a symptom to a root cause without a week of log spelunking?
None of these can be answered from endpoint-level telemetry. Answering them requires trace-level visibility. It requires a record of every step the agent took, in order, with context. That's the shift agent observability has to make.
What agent observability actually captures
A trace is a tree of spans, and each span is a single step the agent took. The outer span represents the agent run as a whole. Inside it, child spans capture every LLM call, every tool invocation, every retry, and every sub-agent that was delegated to along the way, which brings its own subtree.
Here's what that shape looks like in practice:
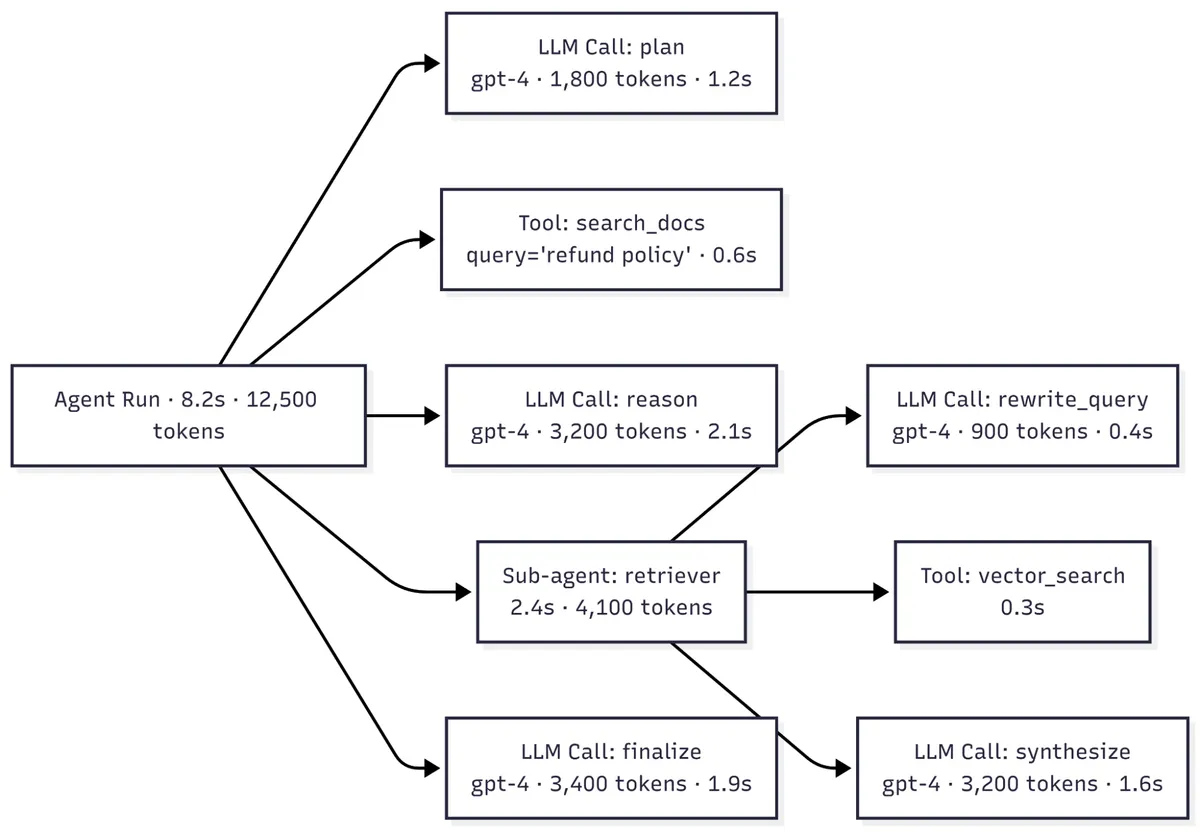
Fig. A single agent run as a tree of spans. Each span carries the model used, tokens consumed, and time taken. The whole tree is one trace.
The tree is where the value is. Every span carries a small structured payload which includes the model name, input and output token counts, latency, the tool that was called, the arguments passed to it, and the result it returned. That's enough to reconstruct exactly what happened, step by step, without asking the developer who wrote the agent.
This works across vendors because the attribute names are starting to standardize. The OpenTelemetry GenAI semantic conventions define a shared vocabulary for LLM calls, tool calls, agent workflows, and token usage:
gen_ai.request.modeltells which model was usedgen_ai.usage.input_tokens/gen_ai.usage.output_tokenstell the token countsgen_ai.client.operation.durationtells latency, aggregated across calls (a single call's latency is just its span's start and end time)
These conventions are still pre-1.0, and the naming will keep shifting, but they're the closest thing the field has to a common language. A runtime that emits them can be read by any OTel-compatible backend.
OpenInference, maintained by Arize, is a similar but separate convention that predates the OTel GenAI work, with more mature definitions for agent and RAG spans specifically. Both run on standard OpenTelemetry, but they just disagree on attribute names, not on the underlying transport.
Because of that, many production stacks emit both on the same span. Traces render natively in OpenInference-aware tools like Phoenix while also matching what OTel GenAI-based backends expect. The ecosystems are gradually aligning, although today many teams emit both.
The three questions, answered at the span level
Once the trace tree exists, the questions leaders keep asking become answerable.
- Where did the tokens go? Every LLM span carries input and output token counts. Aggregate them by agent, by step, by user, and by tool call, and the monthly bill stops looking like a single number. Instead, you start to see patterns. One agent runs a 4,000-token planning call for every user query. Another has a summarization loop that fires three times when once would do. A third quietly jumped from 800 tokens per call to 2,400 after last week's prompt change. Those are the places you can optimize.
- Where did the seconds go? Span latency is a direct read. If a user request takes eleven seconds, you can see whether nine of them were the LLM waiting on a response, or whether the model returned in one and a vector search took the other ten. The bottleneck stops being a guess. It becomes something you point at.
- Which agent, which step, which run? Each trace carries an identity. This includes agent name, a run ID, a workflow ID. When something misbehaves in production, you don't reconstruct events from log lines. You open the trace for that specific run and look at the tree. Debugging shifts from archaeology to reading.
Three separate-sounding questions, one underlying dataset. That's the practical point worth landing. The moment the trace exists, the three questions collapse into different views on the same tree.
Where the telemetry has to come from
Everything in the previous section assumes the trace exists. In most systems, it doesn't, at least not by default. What separates a team that can answer these questions from one that can't isn't the dashboard they picked. It's the layer that emits the telemetry in the first place.
Teams generally take one of three paths to producing it:
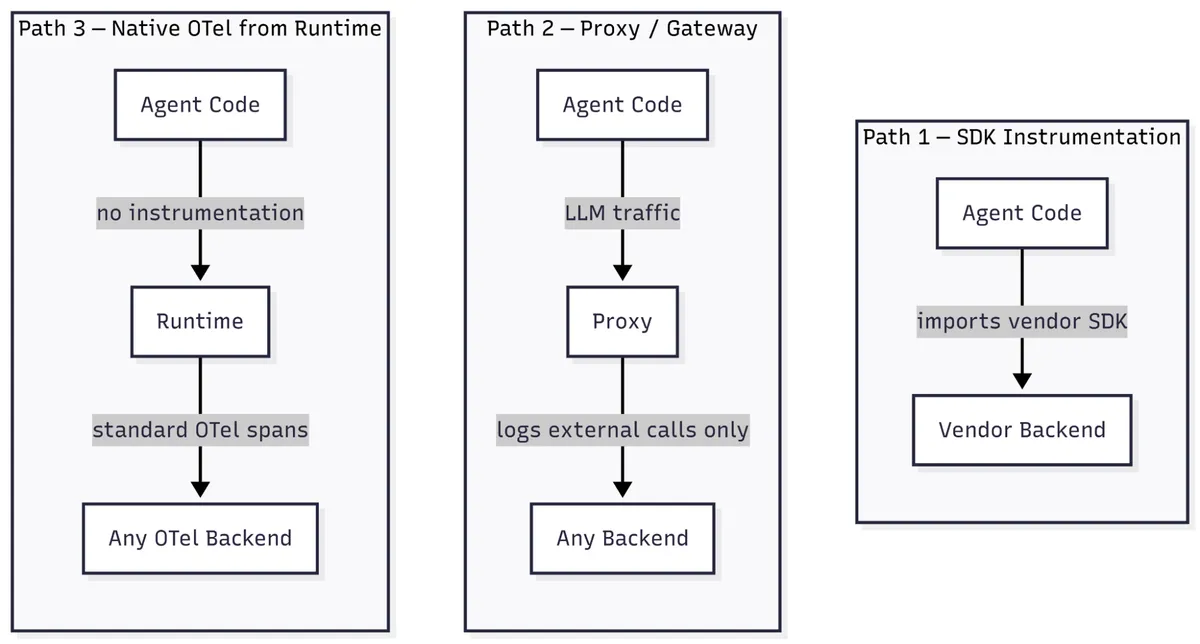
Fig. The three ways agent telemetry gets produced. Each makes a different tradeoff on richness, coupling, and coverage.
SDK integrations
The observability vendor ships a Python or TypeScript library that wraps LLM clients and tool calls, and developers instrument their code by calling into it. The data is rich and tightly aligned with the vendor's UI. The tradeoff is coupling. The instrumentation becomes a hard dependency on that vendor's SDK, and switching backends means re-instrumenting code across every agent.
Proxies or gateways
Traffic to the LLM providers is routed through an intermediary that logs it along the way. It's the fastest to set up and the least invasive to application code. But a proxy only sees the outside of each model call. It can't see what the agent does between calls, including tool executions, state operations, or cross-agent handoffs. As a result, the trace is incomplete.
Native OpenTelemetry emission from the runtime
The runtime that the agents run inside emits standardized OTel spans directly, for every operation it manages. There's no SDK to install and no proxy to route traffic through. The tradeoff is that this path only exists if the runtime supports it. If it doesn't, you're back to one of the first two options.
None of these is inherently wrong. But the differences compound. A team that starts with a proxy for a fast quick-win often finds itself grafting on an SDK for the internal steps six months later. Then, the first time it wants to change observability backends without rewriting its agents, it starts thinking about a runtime shift.
What this looks like with Diagrid Catalyst underneath
Diagrid Catalyst is a reliable and secure platform for running agentic workloads in production, with the Dapr runtime, state stores, and message brokers managed for you. On the observability front, it takes the third path.
Where Diagrid Catalyst plays is the emission layer, not the dashboard. It doesn't compete with Langfuse, Phoenix, Datadog, or New Relic on analytics or visualization. What it does is make sure the telemetry those tools need is already there, in a standard shape, without a separate instrumentation SDK sitting inside the agent code.
Once agent observability is enabled on a Dapr Agent, the runtime emits OpenTelemetry spans following OpenInference conventions for every workflow invocation, every LLM call, every tool call, and every state operation. The spans carry the same attributes the last two sections described (model, token counts, latency, tool arguments), and any OTel-compatible backend can ingest that stream directly.
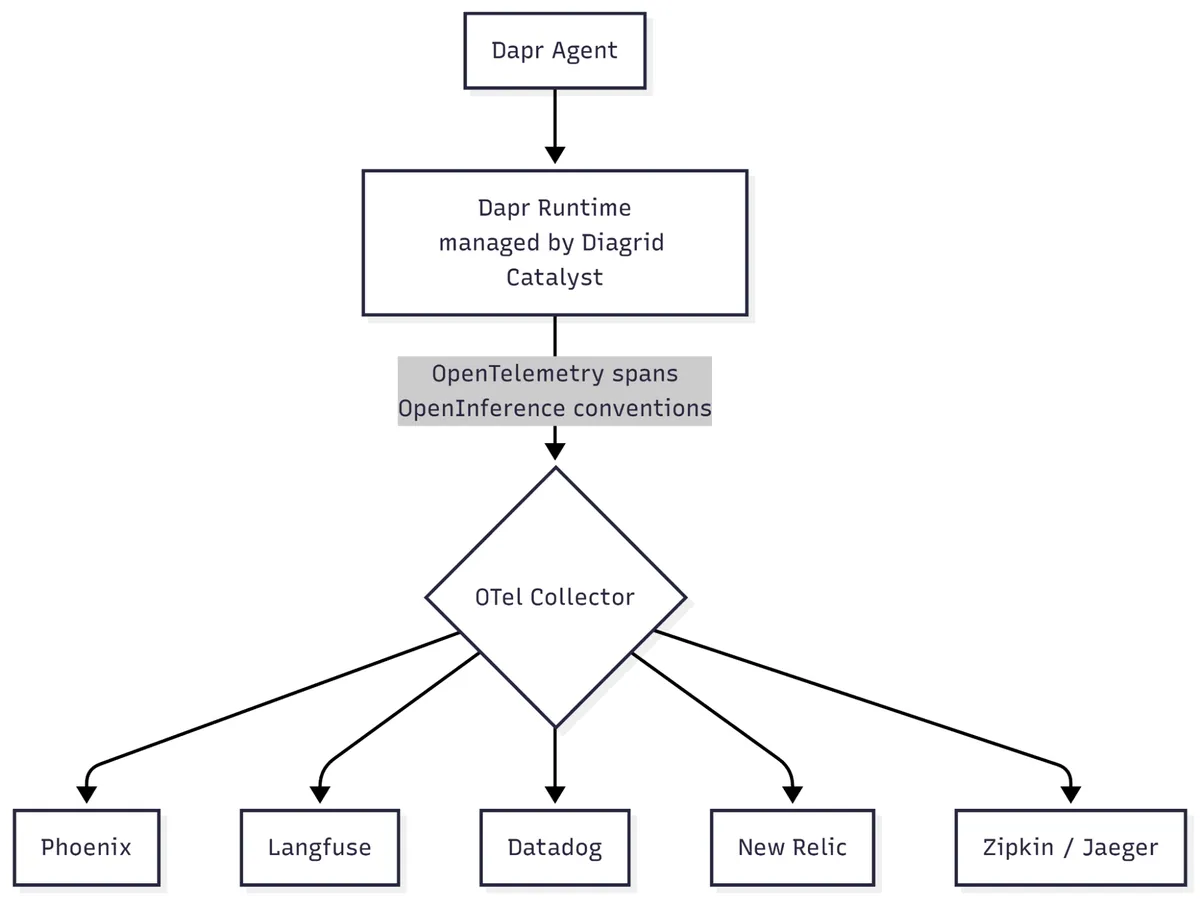
Fig. With Diagrid Catalyst as the runtime, telemetry is emitted once, in a standard shape, and can flow to any OTel-compatible backend. The choice of dashboard stays with the team.
Teams already using Diagrid Catalyst for durability get observability emission as part of the platform. There is nothing extra to instrument and nothing extra to maintain. There's no observability vendor SDK sitting inside the agent code, which means the backend can change without rewriting anything. Because the runtime emits both OTel GenAI and OpenInference conventions, the same traces render natively in Phoenix and flow cleanly into Datadog. The team doesn't have to choose between observability ecosystems.
Diagrid Catalyst also renders traces, workflow execution graphs, and per-agent metrics inside its own console. So early on, before the backend of choice is wired up, the debugging surface is already there. The Diagrid observability docs walk through what this looks like in a running project.
Where to go next
The difference is simple. Teams with trace-level visibility can explain where the tokens and seconds went. Teams without it are still guessing.
Agent behavior forms a tree, and observability is about capturing that tree cleanly. The most useful traces come from the runtime that already knows what the agent is doing, not from a layer added afterwards. Once that telemetry is in place, teams can use the observability backend of their choice while answering the same questions about spend, latency, and execution.
That leaves a second question, which is what to do once the visibility is there. Seeing where tokens go is the first move. Actually controlling where they go, through model routing, per-agent budgets, guardrails on runaway workflows, and evaluation loops that catch quality regressions before they hit production, is the next one. It's where most teams end up next, and it's where a good chunk of the operational work in production AI now lives.
If you want to see how durable agents get built on Dapr from the ground up, since that's the runtime this whole approach depends on, the free Dapr Agents course at Dapr University is the fastest place to start.
