
Production-grade Dapr on Kubernetes
Automate operations, enforce security best practices, improve uptime, and elevate insights across all your Dapr Kubernetes clusters.
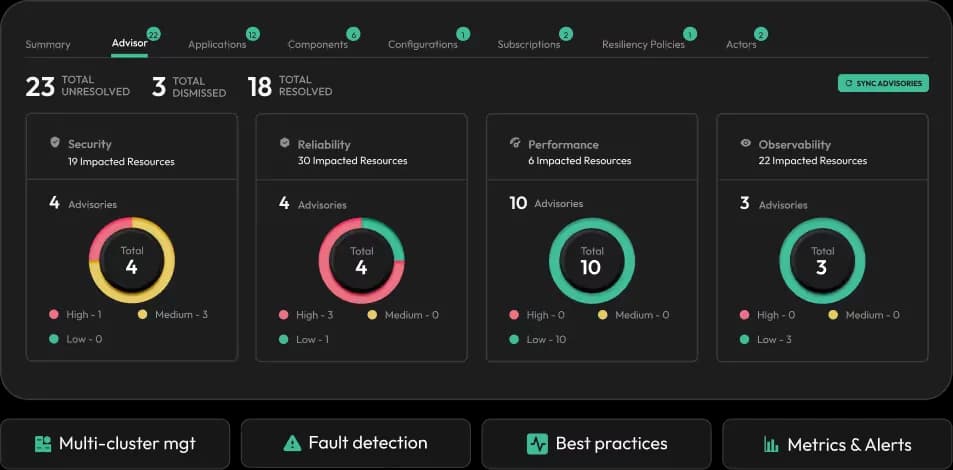
Operational excellence
- Save days managing rollouts of Dapr versions with automatic upgrades/downgrades
- Save up to 80% infra cost by optimizing application resource usage & controlling costs
- Monitor & manage multiple Dapr clusters across any Kubernetes distribution
Security & reliability
- Apply production best practices saving up to 15 days of developer time per year
- Automatically schedule certificate updates with zero downtime
- Stay current on Dapr versions & security patches in 72 hours
Insights & collaboration
- Real-time analysis & alerting on over 150 Dapr metrics
- Diagnose application, error, and latency issues, cutting discovery time by 70%
- Visualize app dependencies & share with team saving up to 10 hours per month
Try Diagrid Dapr Dashboard
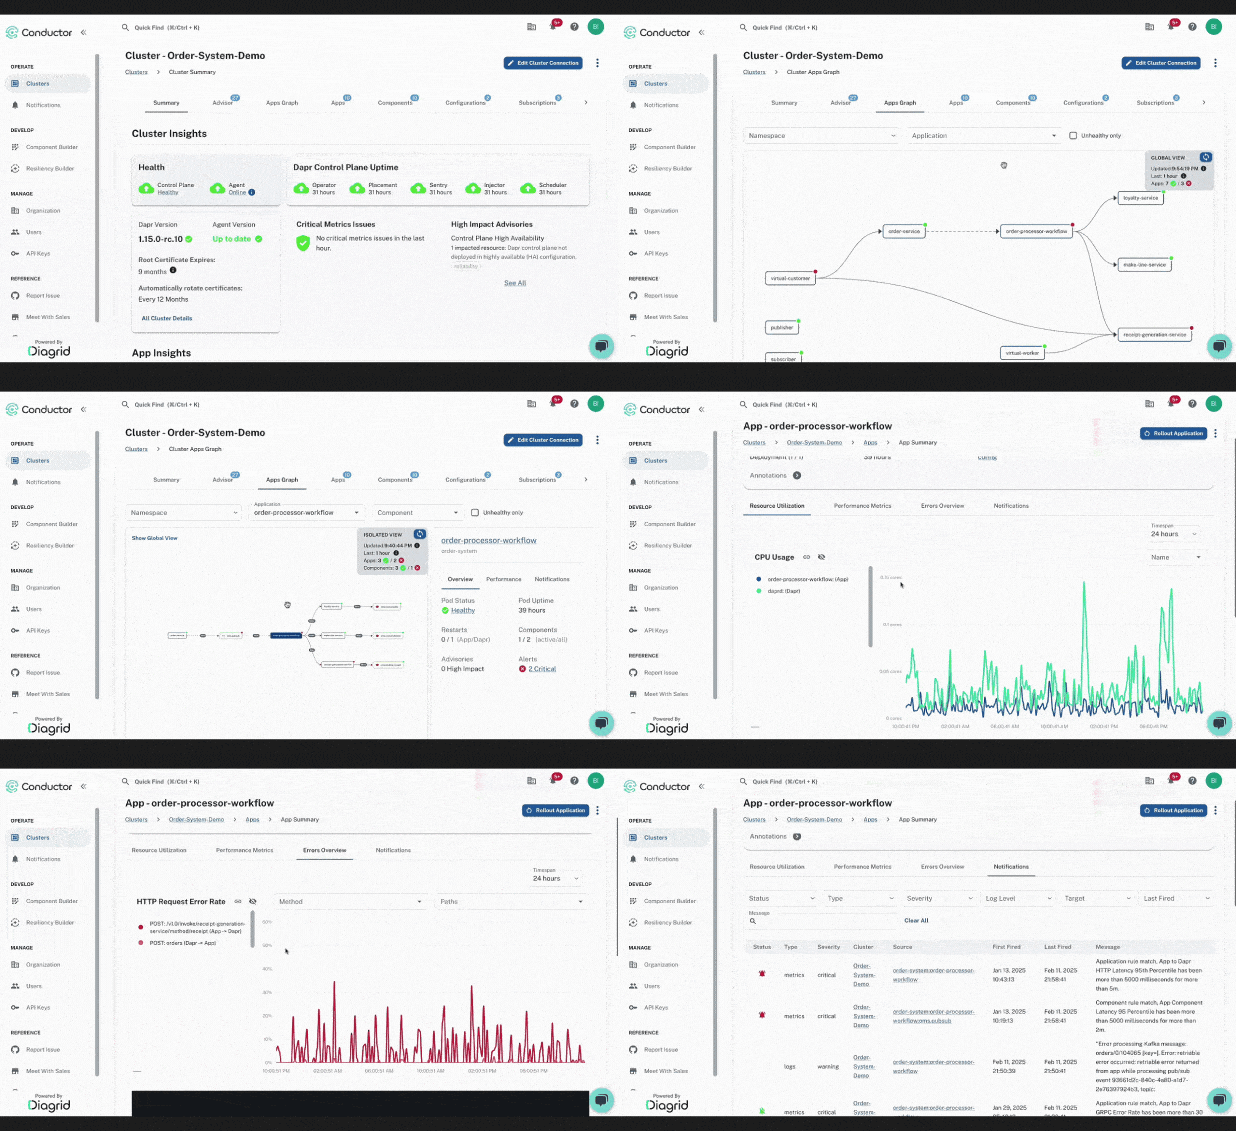
Get a firsthand experience with Diagrid Dapr Dashboard through our read-only Dapr demo installation. Explore applications, visualize network topology, dive into graphs and notifications, and see how Diagrid Dapr Dashboard simplifies Dapr management.
What are customers saying?
Diagrid Dapr Dashboard, like Dapr, is an exceptional product that can revolutionize how developers produce & manage products.
We really consider Diagrid Dapr Dashboard as life insurance for our continuously growing microservices environment.
The guidance from Diagrid Dapr Dashboard's advisories helped us optimize usage of Kubernetes resources, reducing cost without compromising on performance.
Software Engineering Manager
Automotive Software Provider
Fabian Steinbach
Software Architect, Carl ZEISS Vision Int. GmbH
Matt Burpee
Senior Architect, Camelot SI, LLC
Automated Dapr management
One-click installation, upgrade, and patching of dapr with selective application update & automated rollback means you're always up to date.
Start a Guided Tour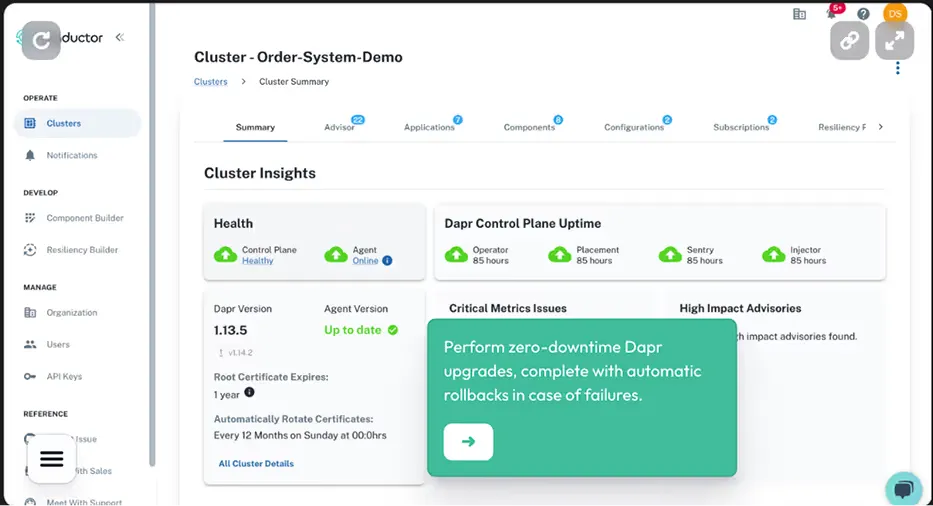
Apply best-practices
Be informed & apply production best practices, with continuous checking to prevent misconfigurations, increasing security, reliability and performance.
Start a Guided Tour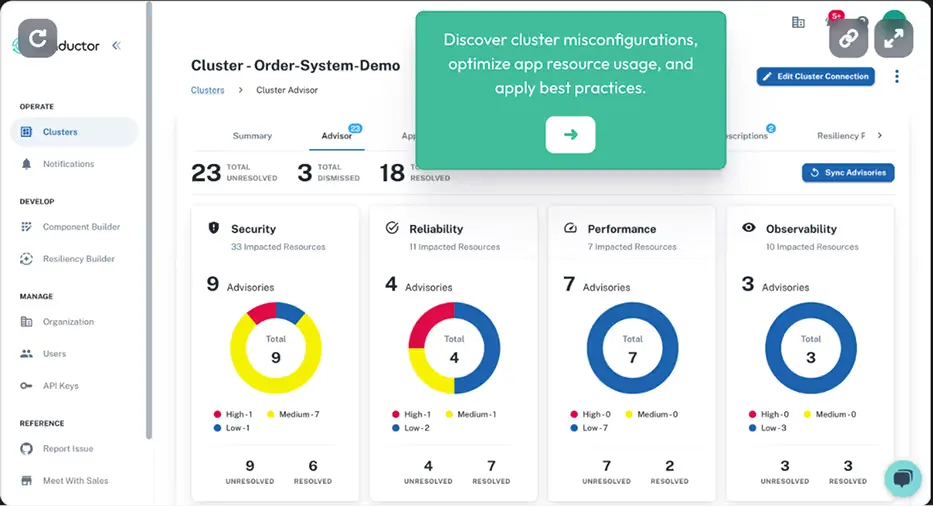
Troubleshoot infrastructure issues
Troubleshoot and fix application and infrastructure issues. Use detailed metrics to quickly address performance, latency, and errors.
Start a Guided Tour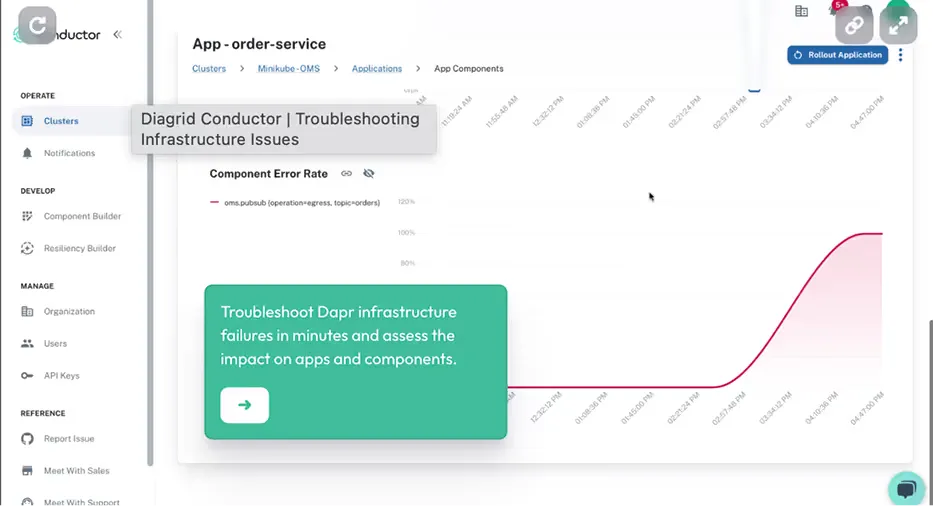
Visualize app dependencies
The application visualizer dynamically shows dependencies and relationships between apps and infrastructure. Understand call patterns and quickly diagnose issues. Facilitate collaboration between dev and ops teams.
Start a Guided Tour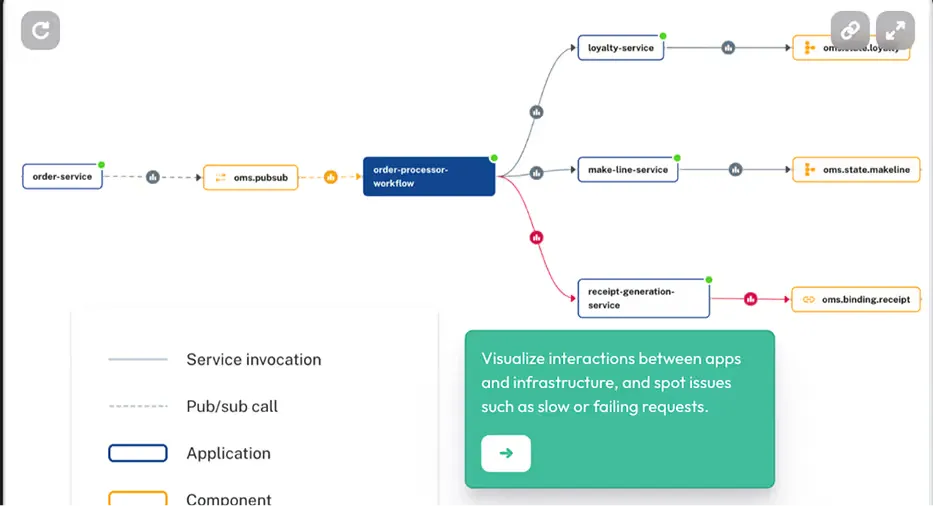
Watch a demo
Diagrid Dapr Dashboard Plans
All features now free forever
Free Forever
All features included:
- Web Console for Single and Multiple Clusters
- Dapr Control Plane Health and Insights
- Dapr Upgrades with Automatic Rollbacks
- Scheduled Dapr upgrades and downgrades
- Zero-downtime certificate management
- Non-Critical and Production-level Advisories
- Application Health and Visualization
- Dapr Component Health Checks
- Actor Details and Metrics
- Custom alerts, with email/webhook notifications
- Comprehensive metrics for rapid troubleshooting
- Metrics API and Grafana dashboard
- Kubernetes operator for GitOps automation
- Support for all major Kubernetes distributions
- New Dapr versions available within few hours
- Cluster-level RBAC and audit logs
- Dapr Resource Builders
More information on Diagrid Dapr Dashboard plans can be found in the Diagrid Dapr Dashboard docs.