How Grafana Security is using Dapr to improve vulnerability scanning
Grafana open source software empowers users to query, visualize, alert on, and explore metrics, logs, and traces, regardless of their storage location. Grafana OSS equips users with tools to transform time-series database data into insightful graphs and visualizations.
Challenge
Grafana Labs offers cloud services on top of this open source software, also including proprietary code with extra features such as RBAC, incident handling, and improved ease of use. Grafana is dedicated to providing customers, whether on-premise or Cloud as-a-service, with software free from vulnerabilities. To aid our engineers in resolving third-party vulnerabilities, the Grafana Security team needed a continuous scanning solution for container images from diverse sources and repositories, both public and private on GitHub.
Grafana Labs’ software, like many others, relies on numerous dependencies, each with potential vulnerabilities that need to be tracked and mitigated. We perceived this as an observability challenge, aligning with our core expertise in solving such problems.
While many SaaS companies offer vulnerability detection services, these can become costly and their results challenging to consolidate, often locking users into proprietary platforms. Therefore, we developed our own light scanning solution, allowing us to expose vulnerability data within Grafana, a tool familiar to all our engineers.
Solution
Vulnerability scanning can be a time-consuming process, with targets coming from different sources at various times. No scans should be missed, and failures should trigger automatic retries.To create a reliable and robust scanning architecture, we implemented a solution running on AWS managed Kubernetes and Dapr, forming the foundation of our event-driven architecture.
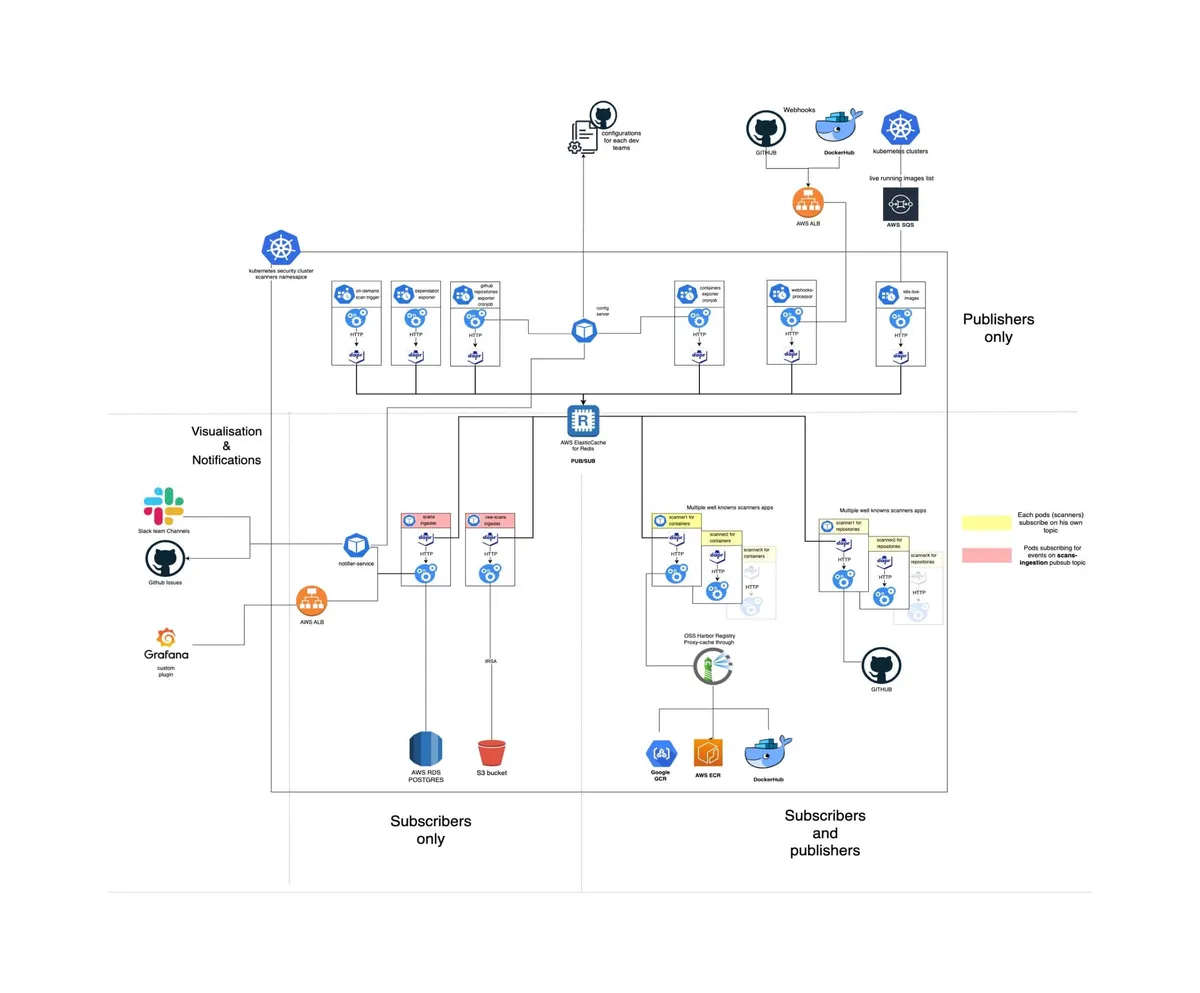
Our architecture can be divided into four principal areas: publishers, subscribers and publishers, subscribers only, and visualization and notification modules.
1. Publishers
These are the pods / cron jobs that will send events. Scans may run on a daily basis, on demand from developer requests or based on webhooks received.
Example workflow with container exporter cronjob:
Let’s illustrate one workflow. While a team of developers can configure some webhooks to have instant scanning of their freshly built releases, they also may want to monitor some of their previous releases that could need security patches. In order to do so, they create a pull request in a dedicated configuration GitHub repository, specifying configuration items such as the container image name, amount of tags to scan, notification preferences, etc.
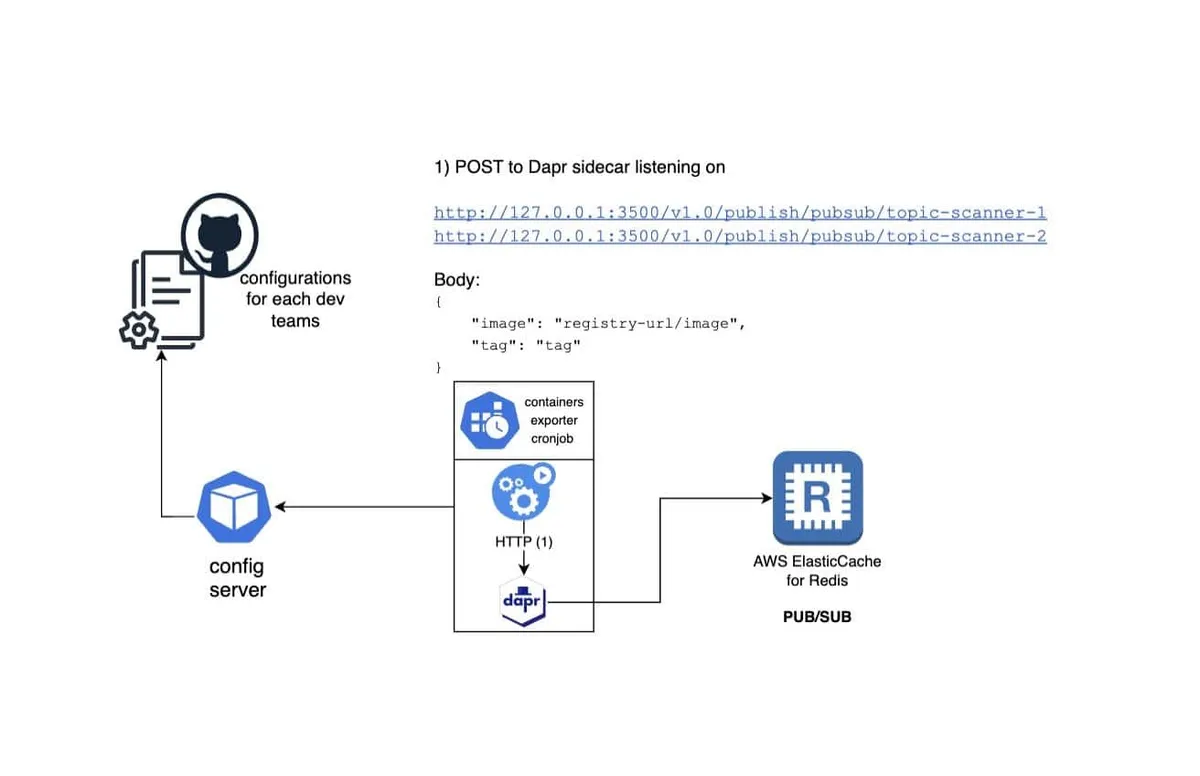
A k8s cronjob, running with a Dapr sidecar, pulls the list of containers to be scanned from the config-server and will call container register API to extract the list of tags to be scanned. Using the Dapr sidecar, it will sends this list to different pub/sub topics for each scanner via POST requests to URLs such as :
http://127.0.0.1:3500/v1.0/publish/pubsub/topic-scanner-1
**http://127.0.0.1:3500/v1.0/publish/pubsub/topic-scanner-**2
etc…
Once all the images have been sent to the Redis queue, the cronjob can shut down, having pulled the config, parsed it, and sent multiple events to different pub/sub topics. Its complete life cycle is done.
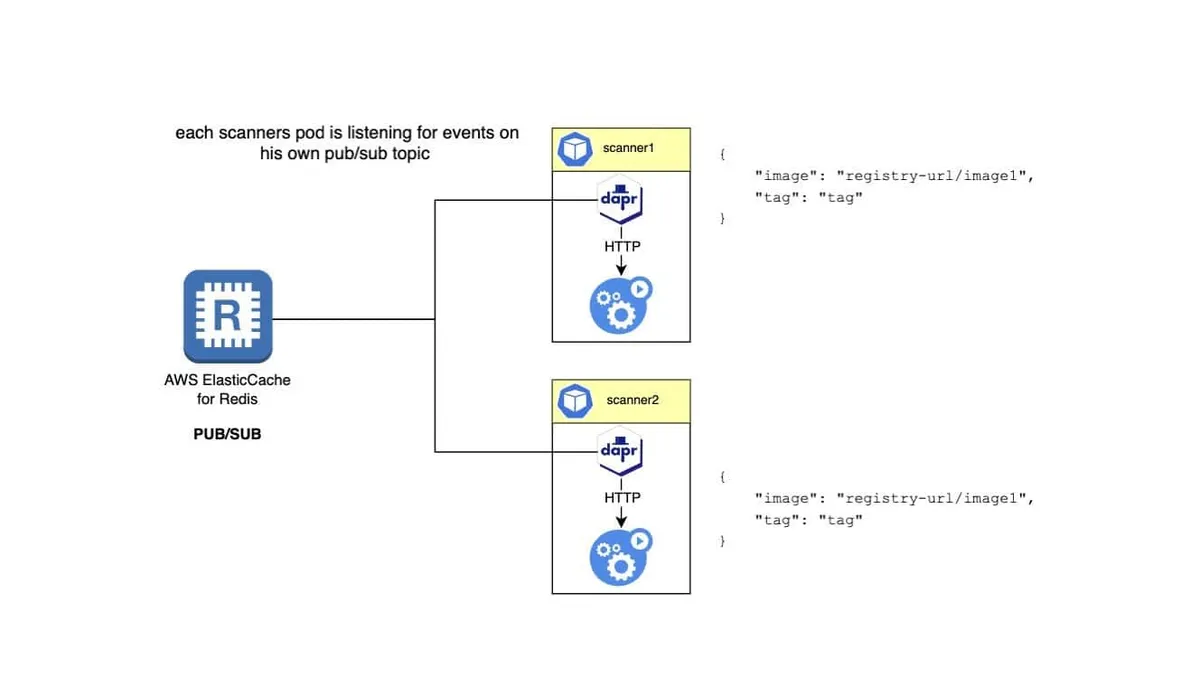
2. Subscribers and Publishers
Next, we describe the subscribers and publishers, typically scanner pods. These pods run container scanner binaries wrapped in a simple Flask application to receive and process events. Each pod has a Dapr sidecar, allowing it to consume events from the Redis queue efficiently and concurrently using dapr.io/app-max-concurrency annotations.
During scanning, failures can occur for various reasons, which is why we leverage yet another great Dapr’s feature: resiliency policies. By applying a resiliency policy in our Kubernetes cluster, we ensure that failed events are retried as much as configured in the policy and, if despite all the attempts, the scan is still failing, moved to the scanner dead letter queue for further investigation.
Dapr guarantees at least once delivery to all of its subscribers but it also means that the same event can be delivered more than once. While idempotency is not a concern here, we don’t want to burn cpu credits for nothing, so there is yet another great solution we found by using Dapr statestore.
When an event has been successfully scanned, we store the successful requests ID as a hash in Redis using Dapr statestore API, so if the same event reaches again the scanners pods, they will be discarded.
When it comes to monitoring, all our logs are shipped effortlessly to Grafana Cloud thanks to Grafana Kubernetes Monitoring. Once ingested, we create the desired alerting upon known error patterns.
Now that the scanner ingested the payload, scanned it, the pod that was initially a Subscriber became now a Publisher. In order to finish his lifecycle, all he has to do is send the scan result to a different topic.
Side note here to mention our use of yet another great CNCF backed project , Harbor Registry.
Indeed, the pods running the scanners need to connect to many different registries ( GCR, ECR, Dockerhub, Ghcr …), thus potentially need to have a plethora of different auth tokens, and since we scan a huge amount of containers, we could also be rate limited. Those 2 issues are addressed by running harbor registry as a pure proxy-cache through service. A single authentication for every registry is now needed and thanks to its cache (stored on S3) , we don’t need to connect that often to the remote registries.
3. Subscribers
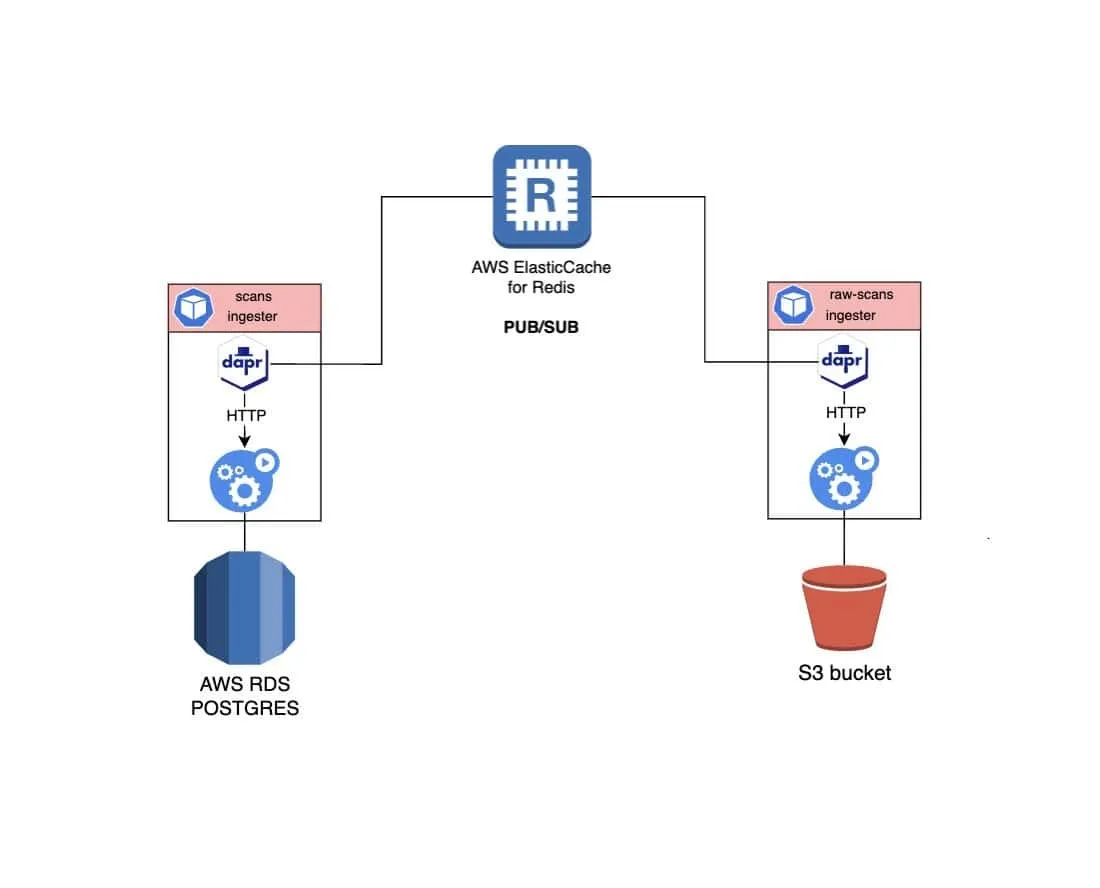
Scanners send scan results to another pub/sub topic (e.g., scan-results). Two pods, each with a Dapr sidecar, listen to this topic. One pod stores scan results in S3 for compliance and debugging, and the other ingests results into a relational database for further processing. It will calculate possible SLOs (client or internal) violations, let developers adjust the real severity of this CVE based on the actual exploitability of the issue, and aggregate issues from different scanners.
4. Visualization and Notifications
As mentioned earlier, one pod having subscribed to events on scan-results topic will process those events and store them in a relational database. This pod also exposes a graphql endpoint to feed our internally developed grafana plugin in order to display all that information in a beautiful and useful way so the developers can view, manage, ignore, change priority for their CVEs directly from Grafana.
Another pod, the notifier pod will be in charge to alert the developer’s team on slack or github, based on their alerting preferences. Those alerting preferences will be pulled from the config server.
Impact
Thanks to Dapr, implementing an event-driven architecture was easy and efficient. Each pod lives his own lifecycle, dependless of the others with Dapr handling the complexities of communication and authentication. This allowed us to focus on developing a quicker working solution. Interaction with the Redis pub/sub broker was easy, as Dapr manages all the heavy lifting. In the same manner, integrating with AWS SQS is effortless due to Dapr bindings, eliminating the need for custom code to handle message queuing.
The reliability of our scanning solution has significantly improved. By relying on Dapr’s resiliency features, we ensured that we were not missing any scans and failed scans were automatically retried, enhancing the reliability of our system. Using Dapr statestore for idempotency checks prevented redundant processing, saving computational resources and improving efficiency.
The impact of our solution extends beyond technical improvements. By integrating vulnerability scanning results into Grafana, a tool already familiar to our engineers, we have streamlined our workflow. Developers can now view and address CVEs directly within their existing monitoring and alerting dashboards, promoting faster response times and better-informed decision-making.
Our architecture also provides flexibility and scalability. The ability to add or modify scanners without disrupting the overall system allows us to adapt quickly to new requirements.
In summary, the adoption of Dapr and the event-driven architecture has transformed our vulnerability scanning process. We have achieved a highly efficient, reliable, and scalable solution that integrates seamlessly with our existing tools.
Read the full case study on the CNCF website
Ready to get started?
See how Diagrid can help you run Dapr in production with confidence.