Unlocking Dapr: Five Reasons to Try Conductor Enterprise
As Dapr's organizational adoption has grown, teams using Kubernetes face the challenge of automating its governance. This post dives into the five most common operational challenges of Dapr in production and how Conductor - now available as a self-service trial - automates them away, saving time and money.
Bilgin Ibryam
Principal Product Manager
The Distributed Application Runtime, Dapr, provides a suite of APIs for communication, state, and workflow leveraging industry best practices for security, resiliency, and observability, solving common distributed systems challenges.
Tasks such as performing upgrades, tuning for performance, monitoring for critical incidents, and securing Dapr applications typically require subject matter expertise and a dedicated operations team. Created specifically for operating Dapr on Kubernetes, Diagrid Conductor Enterprise eases the installation, configuration, tuning, and securing of Dapr clusters in production environments.
Experience Conductor for Yourself, Today
Today we are excited to launch a free trial of Conductor Enterprise, enabling you to experience how Conductor enhances Dapr operations. The trial is a chance for you to try out first-hand how Conductor puts your Dapr operations on autopilot, ensuring optimal performance, fast incident diagnosis and increased security with minimal effort. To demonstrate why Conductor is so valued by our customers, this post discusses the five most common operational challenges of Dapr in production and how Conductor automates these tasks leading to reduced operational hours and compute resource expenditure.
For example, installing Conductor onto customers' clusters has allowed them to discover unknown deployed applications, failing connections to infrastructure services, over provisioned Kubernetes deployments costing them thousands, spikes in CPU usage with applications at certain times of day, passwords deployed in plain text - the list goes on. Dapr makes building distributed applications easy, but running it on Kubernetes is hard. Conductor Enterprise is your autopilot for Dapr. If you just want to get started then sign up today to elevate your Dapr operational experience and discover true insights for production applications. We guarantee you will be surprised by its discoveries! Otherwise, read on to find out more.
1. Detecting and Preventing Security Risks
Dapr greatly aids in developing secure applications through its sidecar architecture, minimizing attack surfaces by isolating applications and their dependencies, however, another challenge lies in securing Dapr itself. Dapr's capabilities like mTLS, access control enforcement, and Secrets Management APIs contribute to application security, but this is effective only when Dapr is secured through regular updates and certificate rorations. Let's explore how Conductor actively contributes to preventing security vulnerabilities in Dapr environments.
Dapr Updates and Dapr Open Source Support
A fundamental aspect of software security is staying updated with the latest versions and promptly applying patches. Conductor automates control plane and data plane upgrades and rollbacks, minimizing human error and ensuring system reliability. With Conductor, new Dapr releases are available within 24 hours of their release in the upstream project. When critical fixes are required, the Conductor Enterprise plan includes the option for custom Dapr open source patches, further enhancing its responsiveness to critical security and uptime needs.
Automated Best Practices
Keeping up with the latest Dapr versions is a solid start, but it's not the complete picture in terms of security. A comprehensive approach to securing a Dapr installation encompasses various measures, including securing the control plane, enabling mTLS, token authentication, and avoiding plain text passwords. These practices should be implemented and enforced in an ongoing, automated fashion, ensuring adherence to the latest best practices.
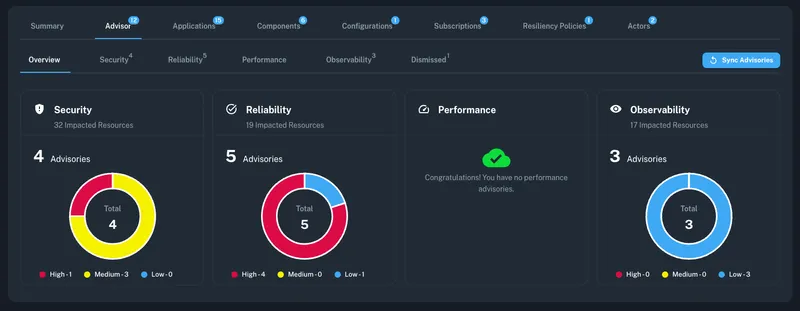
Condcutor Advisor
Conductor Advisor streamlines this process by offering automated checks for production best practices, which can be applied with a single click. This feature integrates continuous monitoring for best practices and misconfigurations directly into build pipelines, significantly reducing the need for manual intervention and ensuring that your Dapr installations are always optimized for security, reliability, performance and observability.
Zero Downtime Certificate Rotation
Dapr secures applications by encrypting traffic with mTLS, but this relies on the regular renewal of root certificates. Failure to frequently rotate certificates can lead to application downtime and compromised security. Conductor tackles this tedious and error-prone task by automating certificate rotation across the control plane and all workloads. This feature allows for zero application downtime during rotation, enabling scheduled rotations at preferred frequencies and times. With Conductor, the need for manual intervention is removed, ensuring continuous and secure operations with always up-to-date certificates.
2. Reducing Downtime
Unplanned downtime, alongside security breaches, ranks as one of the most costly challenges in production environments across industries. While the direct financial cost varies, the consequences of unplanned downtime extend to customer satisfaction and employee productivity. The customer impact can be profound, affecting the company's reputation and leading to customer churn. Internally, downtime not only disrupts customer-facing services but also diverts employee attention from their regular tasks, leading to a decrease in day-to-day productivity. Conductor addresses these issues by enhancing system reliability and uptime, operating across various stages of the software lifecycle to mitigate the effects of downtime on both customers and the company.
Scheduled Changes and Phased Rollouts
Conductor offers the flexibility to execute tasks such as certificate rotations or Dapr upgrades live or at scheduled times for minimal user impact. With its application-specific rollout feature, Conductor allows for selective reloading of applications enabling canary release strategies. This enables a phased approach, where changes are first deployed to less critical environments and applications, prior to being rolled out to more critical environments and applications. This strategy assesses the impact of updates before broader deployment, reducing system-wide risk and ensuring system uptime.
Alerting for Critical Events
Dapr components are the means for applications to connect to backing infrastructure, yet they are validated at runtime, often leading to the discovery of misconfigurations, like incorrect hostnames or credentials, after applications have been promoted to higher-level environments. Conductor addresses this challenge with Dapr component initialization checks. These checks enable early detection of infrastructure misconfigurations immediately after deployment without having to dig through sidecar logs. It’s not only-component misconfigurations that can lead to downtime. Failures in a production environment can occur at multiple levels, from the Dapr control plane to the underlying infrastructure.
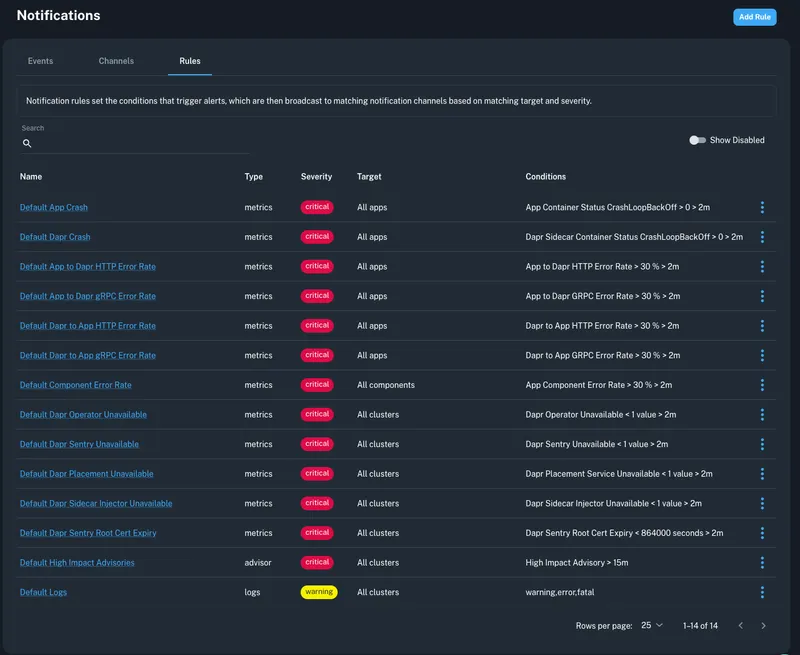
Custom and default alerts for application and infrastructure issues
Conductor provides comprehensive notifications for errors, performance degradation (latency), misconfigurations, and more, offering a holistic view of the entire system. This proactive approach aids in detecting issues before they escalate and cause system-wide downtime, enabling rapid response times for arising problems. Alerts can be sent via email or integrated with popular monitoring systems, like Slack, ensuring you're informed early and ready to act. Conductor also has a built-in Grafana dashboard template for integration into Prometheus and Grafana monitoring systems.
All-in-One Dashboard
In the complex world of distributed systems, disruptions can arise from various factors, such as transient or permanent errors, latency spikes, misconfigurations, obsolete software distributions, and infrastructure failures.
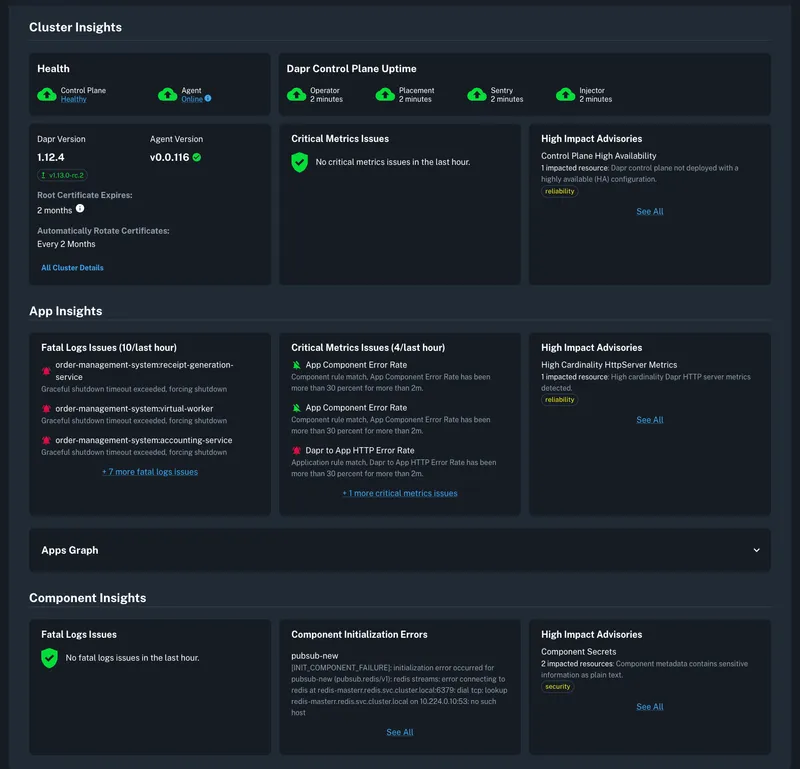
Cluster summary dashboard
Conductor's cluster dashboard provides a comprehensive view, capturing the most critical information about the current state of your system, along with recommended actions to mitigate issues or further investigate. It covers a range of vital aspects, including Dapr control plane health and maintenance, application and sidecar container health, unenforced best practices,and the health of components connected to the backing infrastructure. This centralized dashboard streamlines monitoring and decision-making in a distributed system environment, offering a clear and immediate understanding of your application workloads.
Troubleshooting with Golden Metrics
As Kelvin famously remarked “To measure is to know. If you cannot measure it, you cannot improve it.” When things go wrong, having access to a comprehensive set of metrics and insights is invaluable and Dapr has hundreds of useful metrics at your disposal. Conductor's metrics graphs are designed for such scenarios, enabling precise identification and rectification of issues.
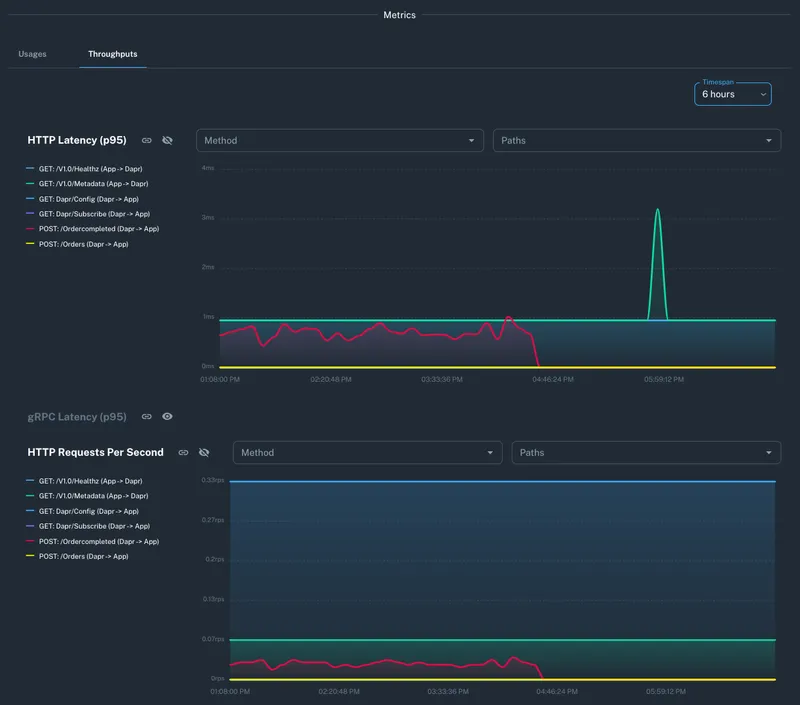
Application networking metrics overview
Conductor’s golden metrics are essential for identifying resource usage anomalies, application glitches, sluggish responses, and infrastructure breakdowns. Through Conductor’s Dapr-focused metrics and user-friendly dashboards, users gain a comprehensive view of their application's status and the system's overall health, key for rapid responses to irregularities. Users have found that using Conductor reduces incident discovery time by up to 70%.
3. Gaining Application Insights
While many tools provide general insights on Kubernetes resources and low-level network usage, they often fall short in delivering detailed information about the interactions among applications and activities within the Dapr runtime. Conductor, with its deep understanding of Dapr, bridges this gap. It offers precise insights into how your applications are using Dapr, the ways they interact, and the specific issues they might be facing. This level of detail extends beyond basic Kubernetes data like Pods and Deployments, and delves into the core of Dapr's runtime environment, providing a clearer, more comprehensive view of your applications' performance and health.
Dynamic Application Topology Visualization
Conductor's Application Graph can map out application topology without the need for passing distributed traces, only based on real-time application metrics. It clearly shows how applications are interconnected, whether through synchronous service invocations or asynchronous pub/sub interactions using message brokers. The application graph provides a system wide overview, encompassing all applications, or you can drill down on a single application and its immediate application and infrastructure dependencies.
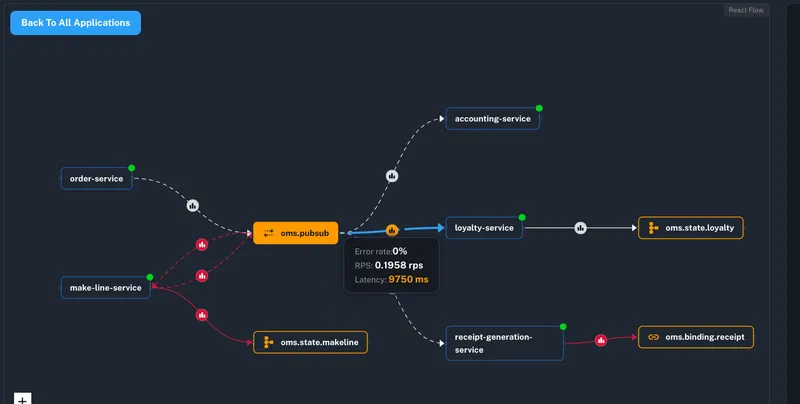
Application and infrastructure interaction graph
Furthermore, the application graph efficiently identifies slow or failing calls, enabling quick attention to problematic areas. This visual tool is not only invaluable for troubleshooting issues but also facilitates faster onboarding of new team members and breaks down barriers between development and operations offering a clear understanding of your application architecture.
Drill Down into Dapr Actors
In Dapr, actors represent fundamental computational units. They have become incredibly popular with development teams due to the combination of state and code with a simple threading model. The Dapr actor runtime automatically activates an actor when a request is received, and if unused for a certain period, is garbage collected. Actor instances are distributed across the cluster, with Dapr smoothly migrating them from failed nodes to healthy ones as needed. While this process is transparent to developers and applications, it can obscure the identification of overloaded system segments and potential issues. There are very few tools that give any visibility to the state of actors.
Conductor delves deep into the Dapr runtime, and exposes insights into actor usage and runtime behavior. This enables you to gain a thorough understanding of actor behavior, including the number of active instances, actor types associated with different applications and the latest actor placement information. These insights reveal when and how actors are activated, distributed, and performing, a level of detail beyond the scope of standard Kubernetes tools and specific to Dapr's inner workings.
Resiliency Policy Visibility
In the realm of distributed applications, failures can result from a range of issues, including hardware failures, unexpected spikes in traffic, or application lifecycle events like scaling and restarts. Detecting, mitigating, and responding to these failures are critical aspects of building a robust and self-healing system.
Dapr offers resiliency policies, including timeouts, retries, and circuit breakers, to bolster distributed system resilience. While these policies excel in detecting and transparently recovering from transient failures, they can also obscure underlying issues. For instance, frequent retries or a often-open circuit breaker may signal an overloaded system that remains undetected. With Conductor, you gain visibility into resiliency policy configurations, the applications that use them, and the usage rate of the policies. This helps in understanding your distributed system's health and behavior, empowering you to proactively address potential challenges.
4. Saving Time and Compute Cost
Securing Dapr and increasing uptime are significant milestones in the path towards operational excellence, but doing so in a cost-efficient manner by reducing wasted compute is the next step. Conductor aids in saving operational hours and compute resources, cutting down on routine tasks and leading to a more economical use of compute power, translating into tangible financial savings for your organization.
Automating Routine Tasks
Conductor simplifies one of the most important routine Dapr management tasks through its automated certificate renewal feature. This frees up valuable engineering resources and reduces system downtime by eliminating the need for manual intervention. Furthermore, Conductor automates the process of upgrading and patching Dapr, keeping applications up to date with the latest open-source versions with updates scheduled during low traffic periods. Organizations save anywhere between 5 and 15 days a year with these automations.
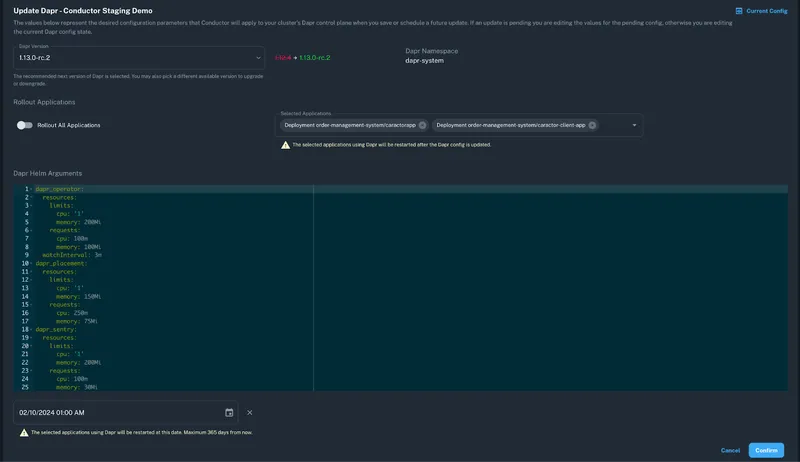
Cluster upgrade form overview
Resource Usage Optimization
Kubernetes relies on container request and limit settings for optimal workload placement on nodes. These settings also define the Quality of Service (QoS) of the pod and its priority during resource starvation events. Inadequate settings can lead to issues with the Dapr sidecar.
Conductor Advisor continuously monitors for any omissions in these settings, along with other advanced configurations, providing timely notifications. However, setting these parameters isn't always straightforward. Many organizations opt for higher request and limit values as a precaution, leading to compute and memory waste. Conductor offers a more efficient solution. By analyzing past resource usage, Conductor optimizes resource allocation for Dapr sidecars and applications, significantly reducing waste and saving cost. It provides optimization advisories for workloads lacking specific resource settings. Each advisory suggests CPU and memory requests and limits for both app containers and Dapr sidecars, based on up to 15 days of usage data.
For ZEISS Vision, Conductor's performance advisories led to an 80% reduction in memory usage for both application containers and Dapr sidecars and saved them thousands of dollars a month. This allowed ZEISS Vision to increase application density and substantially cut cloud costs without compromising on production readiness.
5. Integrating with 3rd Party Tools
A key advantage of leveraging open-source technology is its interoperability and adherence to open standards. Conductor adheres to this principle as well. As a comprehensive tool for managing Dapr, it's designed for integration with a range of third-party tools, aligning with organizations' existing operational software stacks. Beyond its advanced capabilities in cluster management, insightful graphs for troubleshooting, and in-depth advisories, the use of Conductor is not limited to its web console. It offers seamless integration with build tools, facilitates a declarative GitOps approach to cluster management, feeds metrics into various monitoring systems, and enables alerts on different platforms.
Command-Line Access
A Command-Line Interface (CLI) is mostly valued for its ability to automate and streamline tasks, making it a practical choice for experienced users who require quick and precise control over operations. A crucial benefit of the CLI is its integration into DevOps pipelines and other non-interactive tools, fostering a unified and automated workflow. Conductor’s CLI enables efficient management of users, consistent recreation of Dapr Kubernetes clusters, and execution of advisory checks. These advisories are instrumental in identifying any deviations from best practices following recent changes, and in deciding whether such deviations should trigger a failure in the build pipeline.
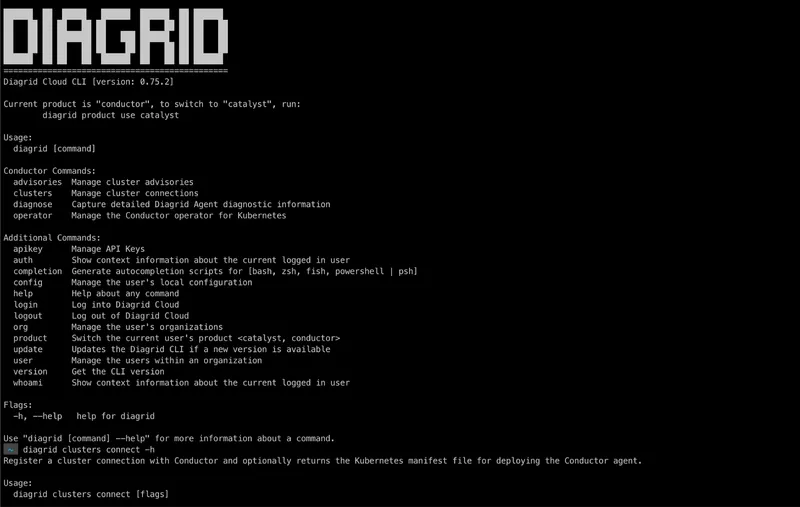
Diagrid Conductor CLI
Seamless GitOps Integration
GitOps, a methodology for Kubernetes configuration management, uses Git as the source of truth. This approach automates infrastructure and application updates using the operator pattern for continuous deployment and monitoring.
Conductor supports GitOps-ready declarative deployments, enabling rapid replication of complete Dapr environments through the Conductor Kubernetes Operator. This significantly reduces the time and effort needed to set up new environments, using Git as the source of truth for both Dapr and Conductor configurations. When a Dapr cluster is managed with the Conductor Operator, the Conductor console transitions to a read-only mode, maintaining full visibility while ensuring that changes are made exclusively through the Kubernetes operator.
Integrating with Observability Tools
While Conductor provides detailed graphs with golden metrics, alerts, and notifications, it doesn't confine users to its console for accessing these features. Operations teams often rely on centralized monitoring and alerting tools that integrate across their organization's entire stack. Conductor accommodates this by exporting metrics in Prometheus format and supplying a Grafana dashboard template for effortless import and immediate use, eliminating the need for manual dashboard creation. This integration allows you to utilize your preferred observability tools to query, aggregate, and transmit metrics to a Prometheus-compatible database, such as Grafana Cloud, seamlessly aligning with your existing monitoring ecosystem.
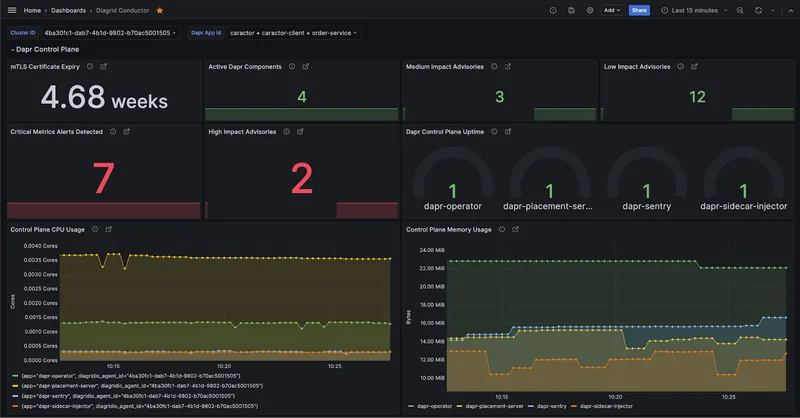
Conductor Grafana dashboard
Try Conductor Enterprise for Free
Conductor saves time, effort, and compute resources by focusing on critical aspects like preventing security issues, reducing downtime, and increasing visibility into your Dapr Kubernetes clusters. Discover how Conductor enhances operations in our detailed Zeiss case study, illustrating its impact on operational efficiency.
Are you already using Dapr on Kubernetes? The fastest way to get your Dapr cluster checked for misconfigurations and best practices and tuning is with the Trial of Conductor Enterprise. Our free sign-up process requires no credit card and provides immediate access to Conductor's full feature set. Once signed up, simply follow our product tour to discover what Conductor has instore for you. We guarantee you will be surprised!