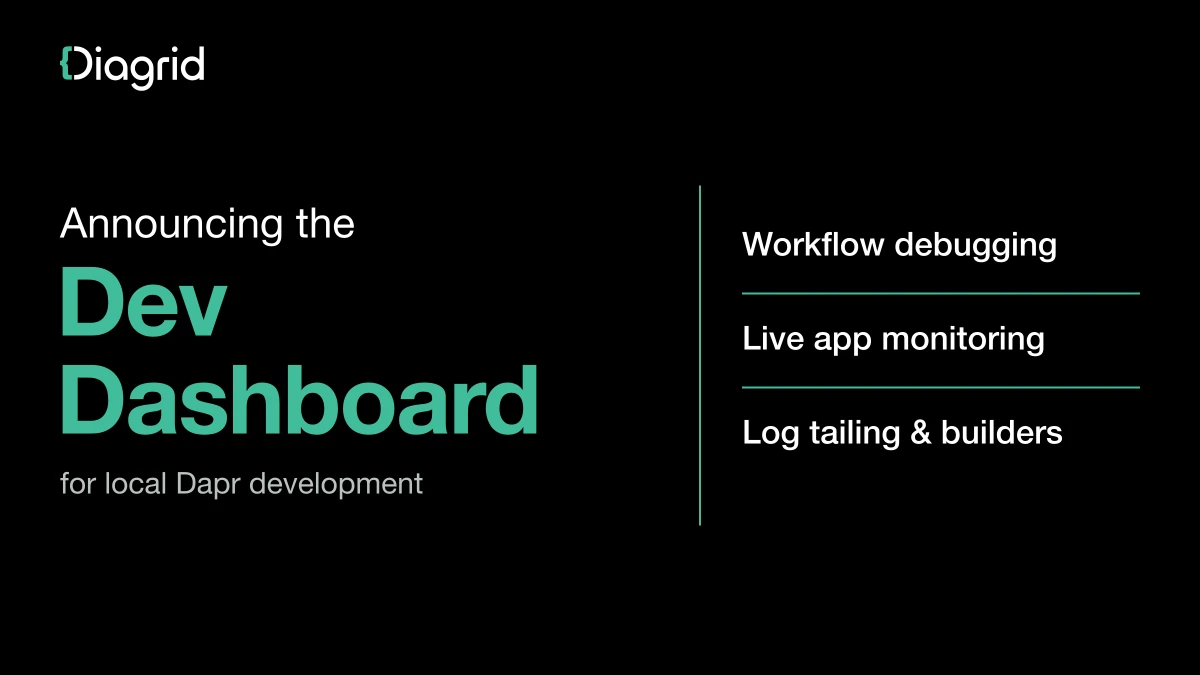
Improving the Local Dapr Workflow Experience with the Diagrid Dashboard
Visualize Dapr workflow state with the Diagrid Dashboard!
Marc Duiker
Developer Advocate
Watch the video announcement
Dapr Workflow is used to reliably automate business processes across distributed applications. Workflows and activities are written in code, and while a code-first approach is great for development, there are still times that you want to use a UI to see the workflow instance state, and inspect the historical execution data, especially during development and debugging.
Now there is a solution for visualizing workflow state, and it’s the Diagrid Dashboard! It’s a local dashboard, that runs as a container, and it uses the data stored by Dapr Workflow by connecting to your local Dapr state store.
Download & run the Diagrid Dashboard
If you use the default Redis state store that gets installed with the Dapr CLI, you download and run the Diagrid Dashboard as follows:
docker run -p 8080:8080 ghcr.io/diagridio/diagrid-dashboard:latestIf you don't use the default Redis store for your Dapr workflows, but use Postgres or SQLite, you need to add a volume mapping that maps your local state store component file to a custom state component file inside the container, and specify the COMPONENT_FILE environment variable to point to that custom state component file:
docker run -p 8080:8080 -v ./RESOURCES_PATH/STATE_COMPONENT.yaml:/app/components/custom_state.yaml -e COMPONENT_FILE=/app/components/custom_state.yaml ghcr.io/diagridio/diagrid-dashboard:latestWhere ./RESOURCES_PATH/STATE_COMPONENT.yaml points to a local state store component file.
Example for a local ./resources/state_postgres.yaml state component:
docker run -p 8080:8080 -v ./resources/state_postgres.yaml:/app/components/custom_state.yaml -e COMPONENT_FILE=/app/components/custom_state.yaml ghcr.io/diagridio/diagrid-dashboard:latestThe terminal will show some logging output including:
level=info msg="starting diagrid-dashboard restservice server on 0.0.0.0:8080Once the container is running, open the Diagrid dashboard in the browser at http://localhost:8080/.
If you run into issues downloading or starting the container image, please have a look at this Diagrid Docs page.
Using the dashboard
Once the Diagrid Dashboard is running, start your Dapr Workflow application as you normally would, via an IDE or via the Dapr CLI, and use the workflow management API to schedule a new workflow instance.
Once a workflow instance is running you will see it in the dashboard:
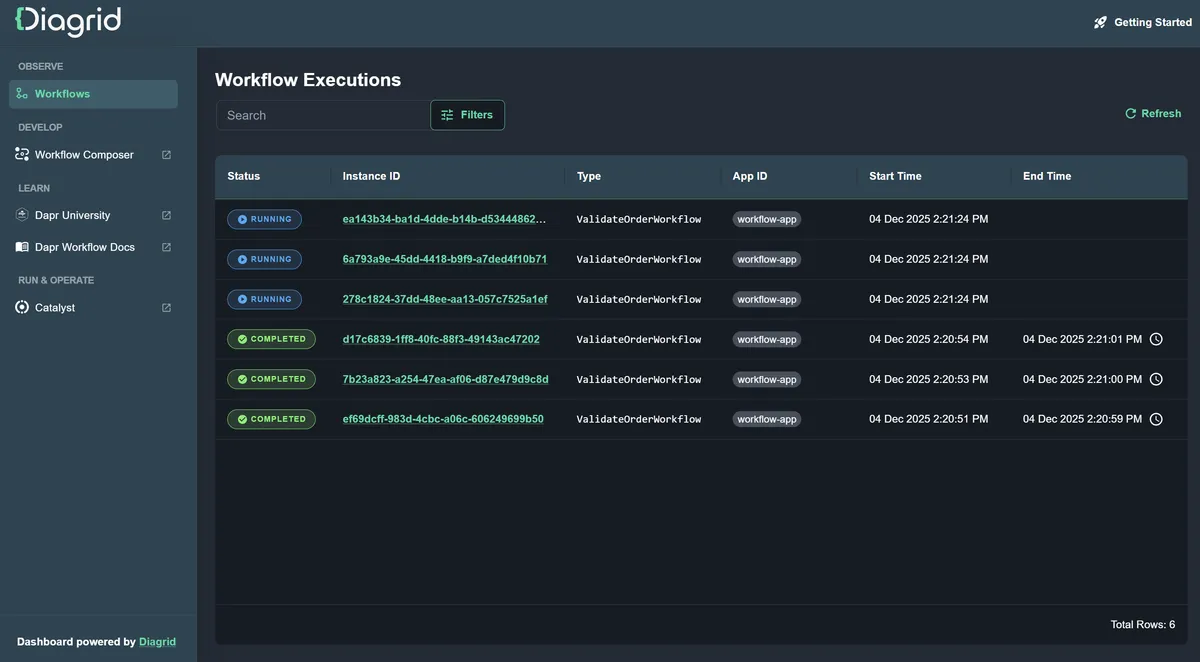
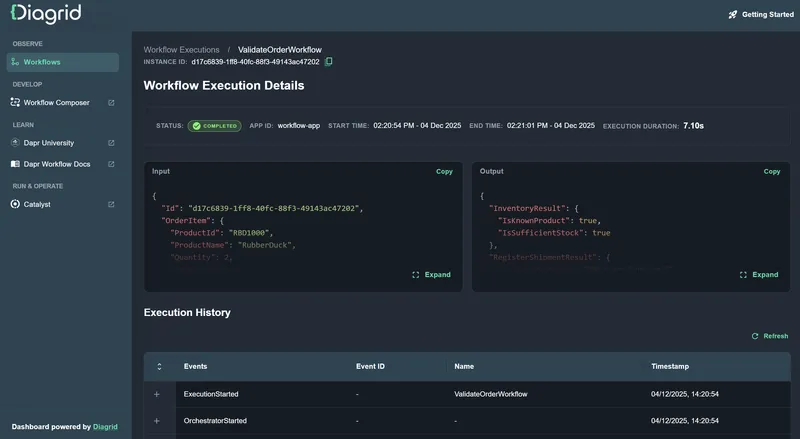
Click on the Instance ID of a workflow instance to drill down to inspect the workflow execution details, including input, output and historical data:
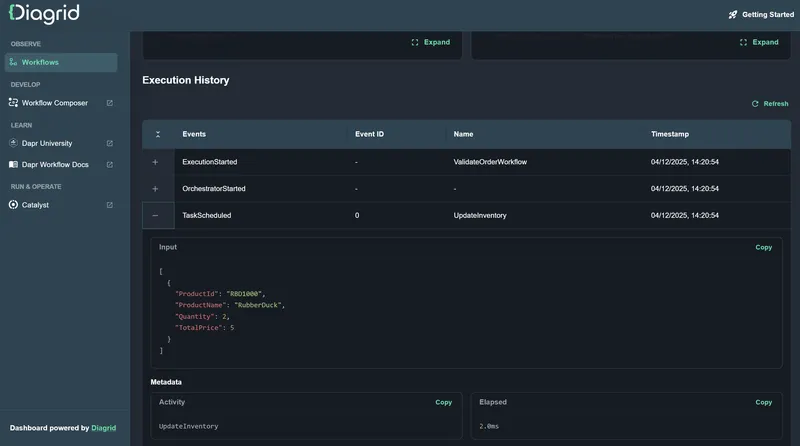
Expand workflow events in the Execution History table to see the details of that workflow step:
Update the dashboard
We just started to develop this dashboard so you can expect many improvements to it. We’re aiming to provide you with the best local development experience for Dapr Workflow and Dapr Agents.
Update the docker image by running:
docker image pull ghcr.io/diagridio/diagrid-dashboard:latestFeedback & more
Let us know what you think about this dashboard! Is there anything you would like to see included in the next iteration? Use the Feedback option in the dashboard to share your thoughts or directly join the Diagrid Discord here.
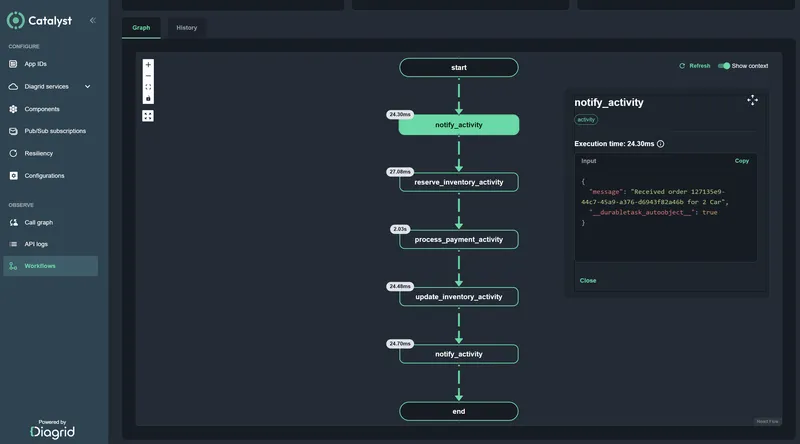
Do you want more workflow visualizations (like a graphical representation of the workflow) and operational control over your Dapr workflows? Try Catalyst, the enterprise platform for workflow orchestration and agentic AI, powered by Dapr.